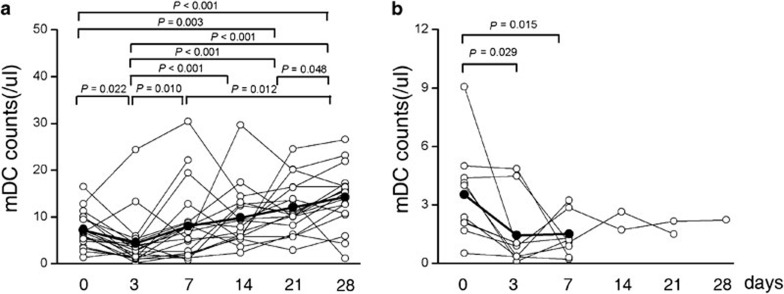
Figure 6.
The numbers of myeloid dendritic cells (mDCs) in methylprednisolone-treated patients during the 28-day fellow-up periods. Distribution of circulating mDCs in surviving (a) and non-surviving (b) acute-on-chronic liver failure patients. The P values between different time points are shown. Each symbol represents one individual and each line represents the changes in an individual patient's mDC numbers. The solid line depicts the mean numbers of mDCs.

