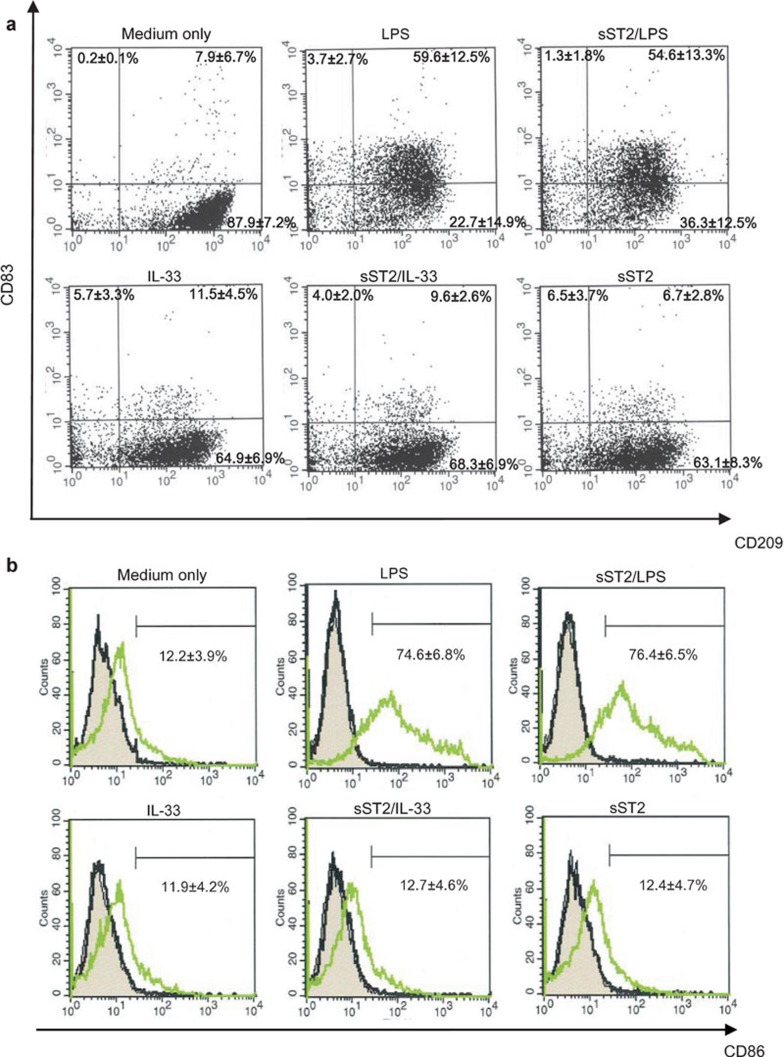
Figure 2.
Characterization of MDDC phenotypes after various stimuli. iMDDCs were pre-treated for 1 h with or without sST2 (100 ng/ml), and the cells were stimulated with LPS (100 ng/ml) or IL-33 for 48 h at 37 °C. (a) The expression levels of CD83(PE) and CD209(APC) were detected by flow cytometry using the Mo-DC Differentiation Inspector. (b) The expression levels of CD86(PE) were detected using the anti-human CD86 antibody. A gray area is presenting MDDCs without staining after various stimuli. A black line shows MDDCs stained by mouse Ig-G1 as isotype control. A green line is MDDCs stained by anti-human CD86 antibody. The percentage of the each positive quadrant area is indicated as the means of three experiments±s.d. Mo-DC, monocyte-dendritic cell; IL, interleukin; iMDDCs, immature monocyte-derived dendritic cell; LPS, lipopolysaccharide; MDDC, monocyte-derived dendritic cell; sST2, soluble ST2 protein.

