Figure 5.

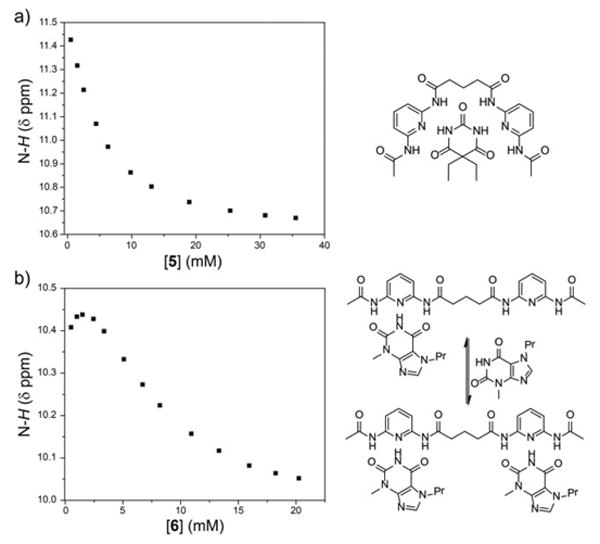
Representative 1H NMR (500 MHz, 25 °C, 5% d6-DMSO in CDCl3) titration data for 1a with 6. Graph of the change in N-H chemical shift with changing concentrations of (a) 5 and (b) 6 in the presence of 3a.

Representative 1H NMR (500 MHz, 25 °C, 5% d6-DMSO in CDCl3) titration data for 1a with 6. Graph of the change in N-H chemical shift with changing concentrations of (a) 5 and (b) 6 in the presence of 3a.