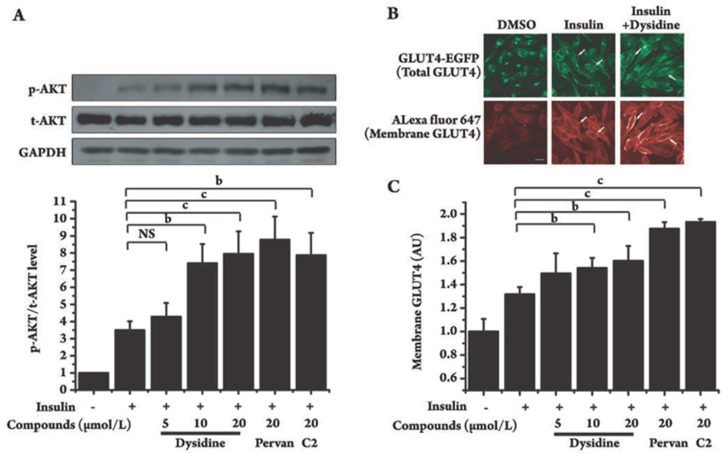
Figure 5.
Dysidine enhanced insulin-stimulated AKT phosphorylation and membrane translocation of exogenous GLUT4 in CHO-K1 cells. (A) The increase of insulin-stimulated AKT phosphorylation by dysidine is shown. Serum-starved CHO-K1 cells were incubated with the indicated concentration of dysidine, compound-2 (C2, 20 μmol/L) or pervanadate (pervan, 20 μmol/L) for 2 h, and then stimulated with insulin (50 nmol/L) for 5 min. Cells were lysed on ice. The phosphorylation levels and total protein levels of AKT were detected by Western blotting, The representative blots were shown in the upper panel and the bottom panel showed the relative quantitation mean±SD. n=3. bP<0.05, cP<0.01 vs control, NS: no significant difference. (B) Distribution of GLUT4-EGFP in resting, insulin (50 nmol/L) stimulated, or insulin (50 nmol/L) and dysidine (20 μmol/L) stimulated CHO-K1/GLUT4 cells is shown. The green fluorescence represents total exogenous GLUT4, and the red represents membrane-located GLUT4, indicated by an arrow. Scale bar, 10 μm. (C) Quantitative analysis of GLUT4-membrane translocation in CHO-K1/GLUT4 cells. Serum-starved CHO-K1/GLUT4 cells were incubated with different concentrations of dysidine, or 20 μmol/L compound-2 (C2), or 20 μmol/L pervanadate (pervan) for 2 h, and subsequently stimulated with 50 nmol/L insulin for 5 min. The membrane-located GLUT4 level was represented by the intensity of red Cy5 fluorescence and normalized by the intensity of EGFP green fluorescence, which represented total GLUT4. The membrane-located GLUT4 level of the untreated cells is represented as “1”. AU, artificial unit. bP<0.05, cP<0.01 vs insulin treatment group. NS: no significant difference.

