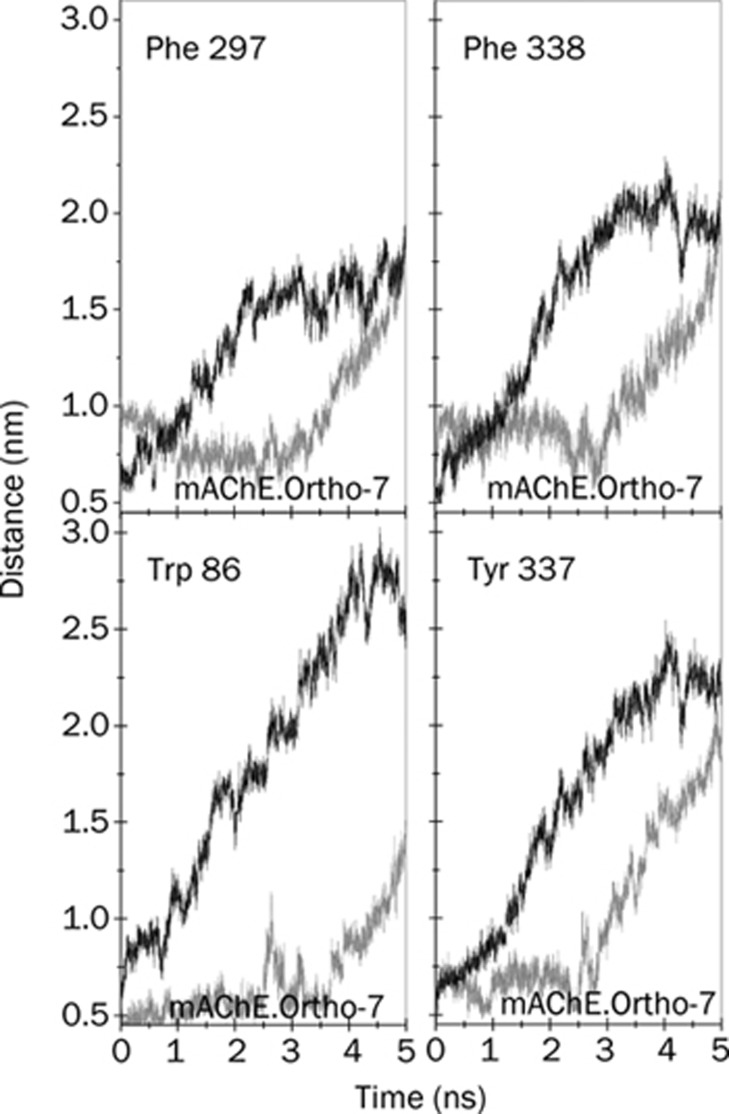
Figure 10.
Center of mass distances between the APR of the drugs and the hydrophobic aromatic residues (other than those at the PAS) of mAChE as indicated in the plots. In all the plots, the SMD pulling results shown by grey lines are for the mAChE.Ortho-7, and the black lines are for the mAChE.HI-6 complexes.

