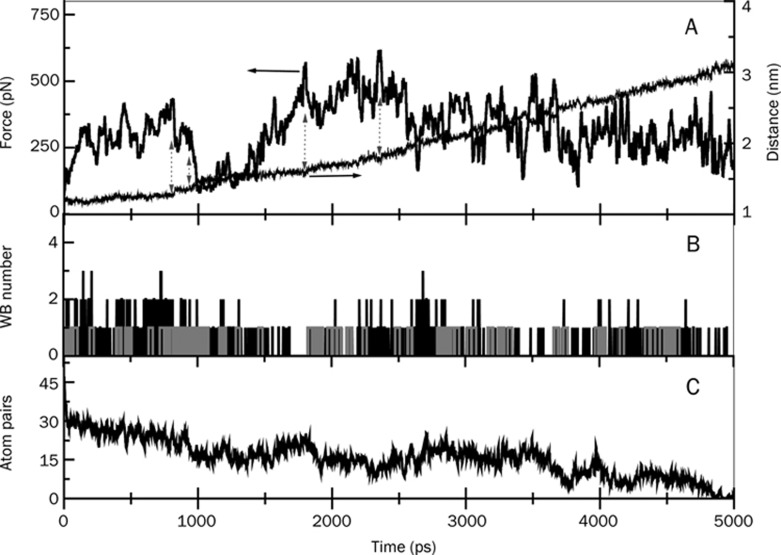
Figure 3.
Pulling force and center of mass distance (A), water bridge (B), and hydrophobic atom pair numbers (C) between the drug and the enzyme shown as a function of time during the exit of the drug, Ortho-7 from mAChE gorge. In (B), the grey-colored bars indicate events in which a given amino acid residue of the enzyme that forms a water bridge with Ortho-7 also forms direct hydrogen bonds between themselves. The plots in parts (A) and (C) are prepared by 10 point adjacent averaging of the SMD results. The double-sided arrows in (A) represent the fall in the force profile from an intermittent peak and subsequent rise in center of mass distance between the enzyme and the drug.

