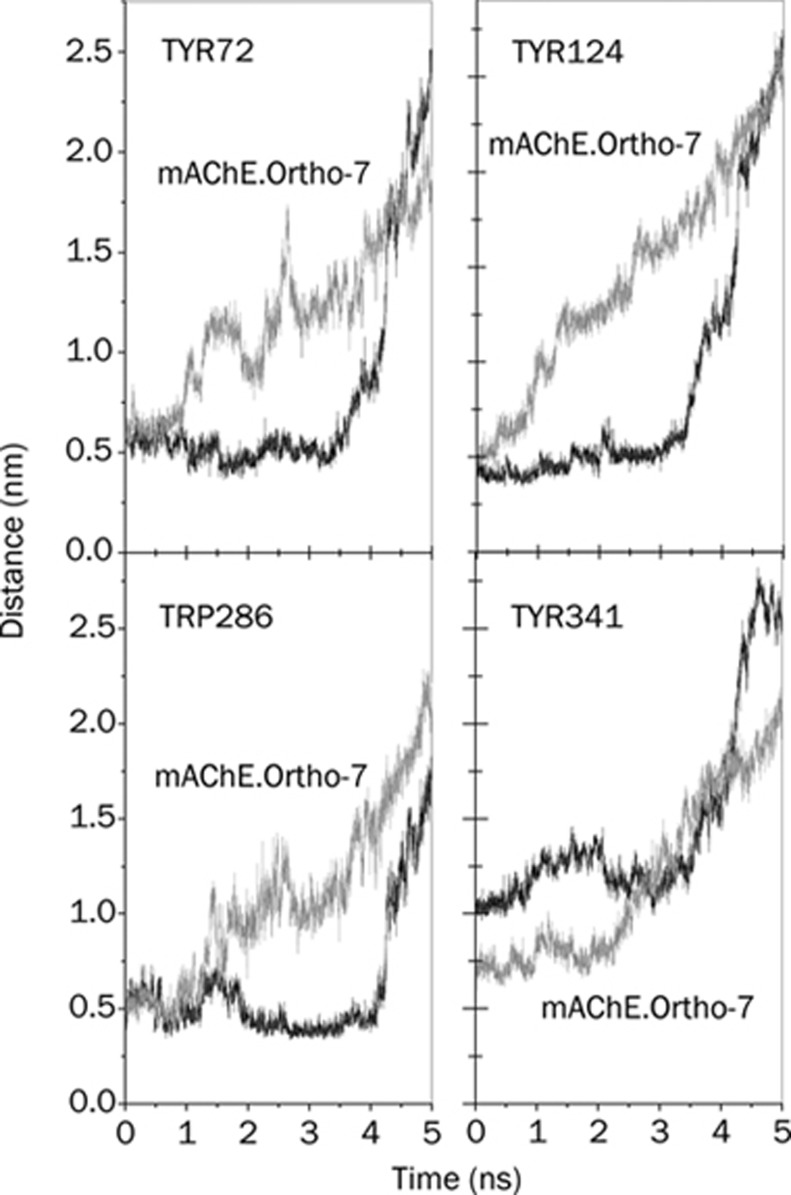
Figure 9.
Center of mass distance between the peripheral pyridinium moiety of the drugs during their exits from the active-site gorge, and the hydrophobic aromatic residues of the PAS of mAChE, as indicated in the plots. Grey lines are the results for the SMD simulation of the mAChE.Ortho-7, and the black lines are for mAChE.HI-6 complexes.

