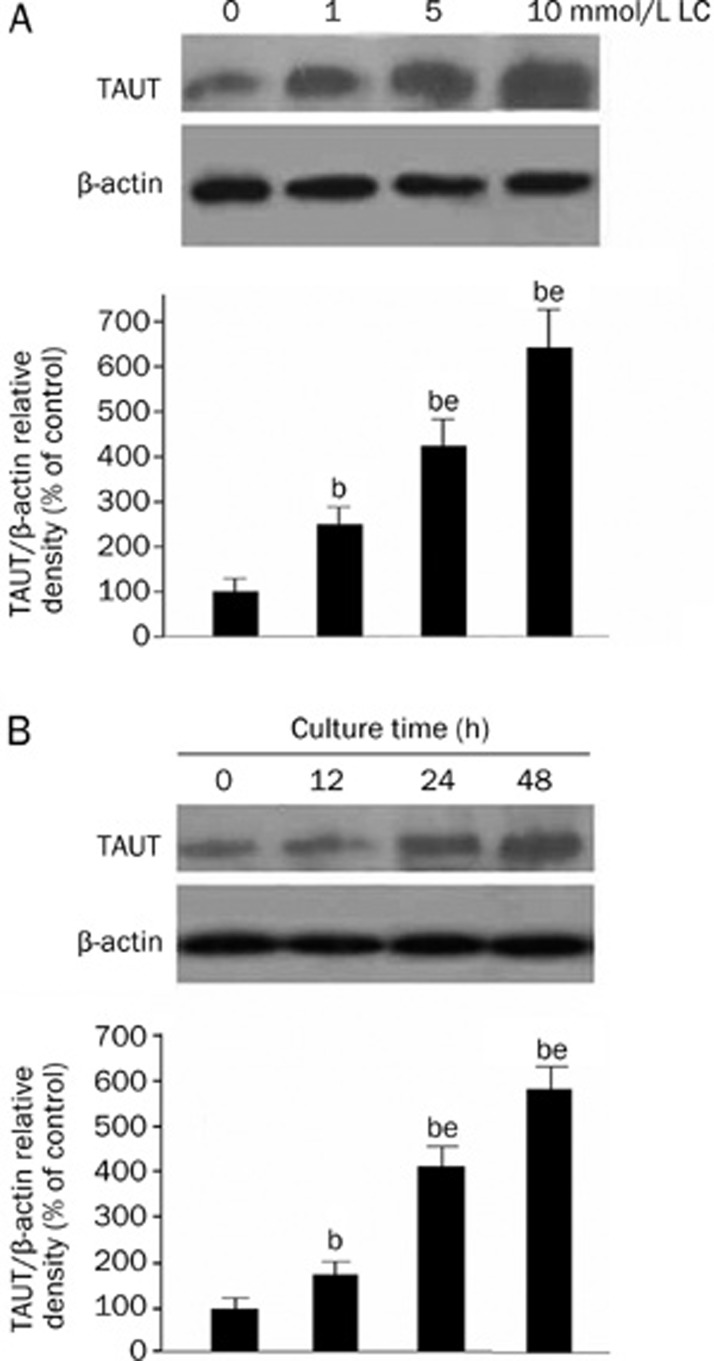
Figure 4.
Western blot analysis of TAUT protein in VSMCs cultured with LC. (A) VSMCs were cultured with different concentrations (0, 1, 5, and 10 mmol/L) of LC for 48 h and then subjected to Western blot analysis. The levels of 70 kDa TAUT and 43 kDa β-actin were quantified by densitometric analysis of the three autoradiograph pictures, and the relative densities of TAUT/β-actin were determined. The bars represent the mean±SD. n=3. bP<0.05 vs the control group; eP<0.05 vs the previous adjacent group. (B) VSMCs were cultured with 10 mmol/L LC for different time (0, 12, 24, and 48 h) and then subjected to Western blot analysis. The levels of 70 kDa TAUT and 43 kDa β-actin were quantified by densitometric analysis of the three autoradiograph pictures, and the relative densities of TAUT/β-actin were determined. The bars represent the mean±SD. n=3. bP<0.05 vs the control group; eP<0.05 vs the previous adjacent group.

