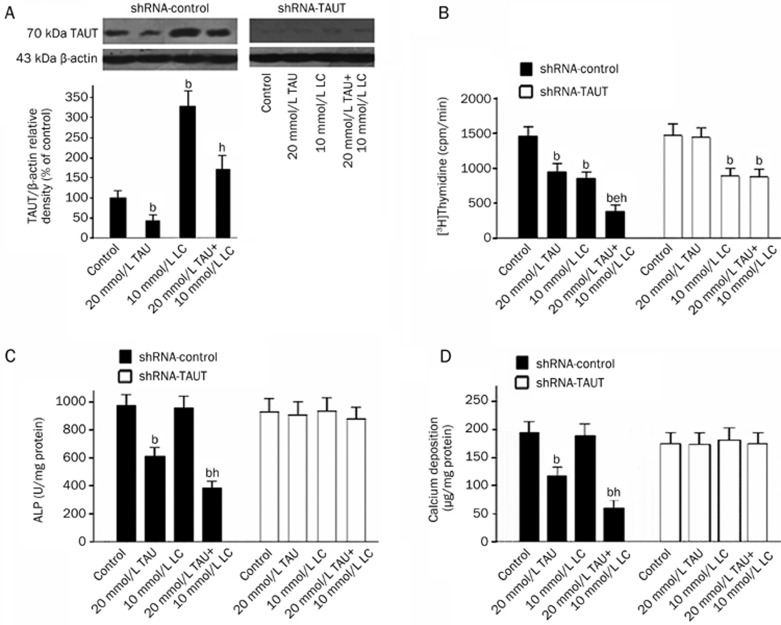
Figure 5.
Impact of TAUT expression knockdown on the anti-mitogenic and anti-osteogenic effects of LC and TAU. (A) Effect of LC and TAU on TAUT expression in the shRNA-transfected cells. Cells were exposed to different agents as indicated for 48 h and then subjected to Western blot analysis. The levels of TAUT and β-actin were quantified by densitometric analysis of the three autoradiograph pictures, and the relative densities of TAUT/β-actin were determined. The bars represent the mean±SD. n=3. bP<0.05 vs the control group; eP<0.05 vs the 20 mmol/L TAU-treated group. (B) Impact of shRNA-mock or shRNA-TAUT on the anti-mitogenic effect of LC and TAU. Cells were exposed to different agents as indicated for 48 h. The results are expressed as counts per minute. The bars represent the mean±SD. n=6. bP<0.05 vs control; eP<0.05 vs 20 mmol/L TAU-treated group; hP<0.05 vs the 10 mmol/L LC-treated group. (C) and (D) Impact of shRNA-mock or shRNA-TAUT on the anti-osteogenic effect of LC and TAU. Cells were cultured in calcification medium with different agents as indicated for 12 d. ALP activity and calcium content were measured, normalized to the cellular protein contents and presented as mean±SD. n=6. bP<0.05 vs control; eP<0.05 vs the 20 mmol/L TAU-treated group.

