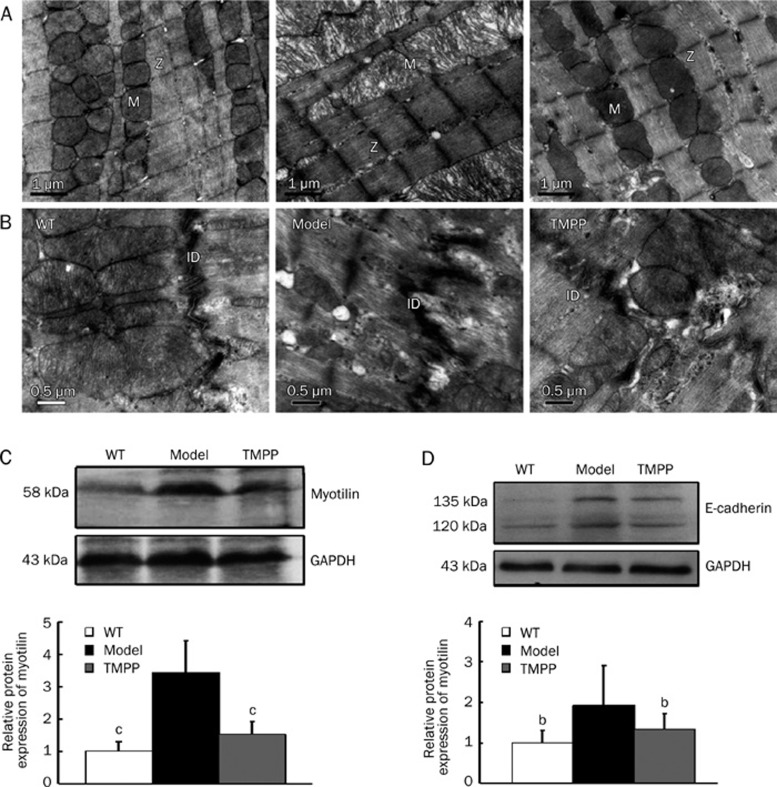
Figure 4.
Representative transmission electron micrographs and the structural protein expression of LV in WT, Model and TMPP mice aged 6 months. (A) Sarcomere Z-disc (Z), mitochondria (M). Original magnification ×20 000. Scale bars=1 μm. (B) Intercalated discs (ID). Original magnification ×30 000. Scale bars=0.5 μm. (C) Western blot analysis for myotilin expression. GAPDH served as a loading control. The bands were quantified by densitometry using Bio-Rad Quantity One software. n=3. cP<0.01 vs Model group. (D) Western blot analysis for E-cadherin expression. GAPDH served as a loading control. The bands were quantified by densitometry using Bio-Rad Quantity One software. n=3. bP<0.05 vs Model group.

