
Figure 6. Insertion speed dependence of infusion pressure for CED at 2 µL/min; A) typical pressure profiles during infusion; B) average peak, steady state pressure, and second peak ( ) for varying needle insertion speeds.
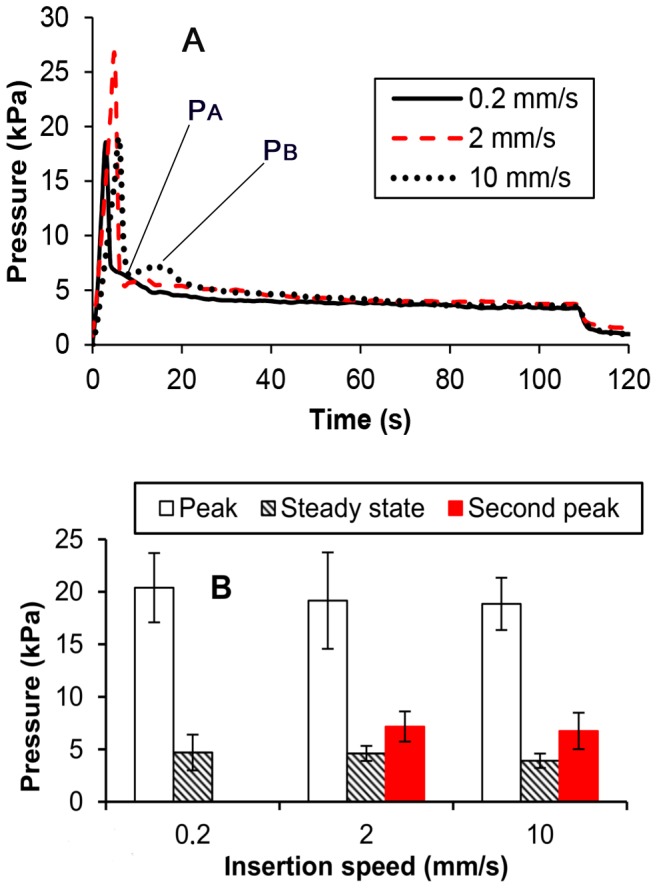
(Bars indicate ±1 standard deviation; n = 8).