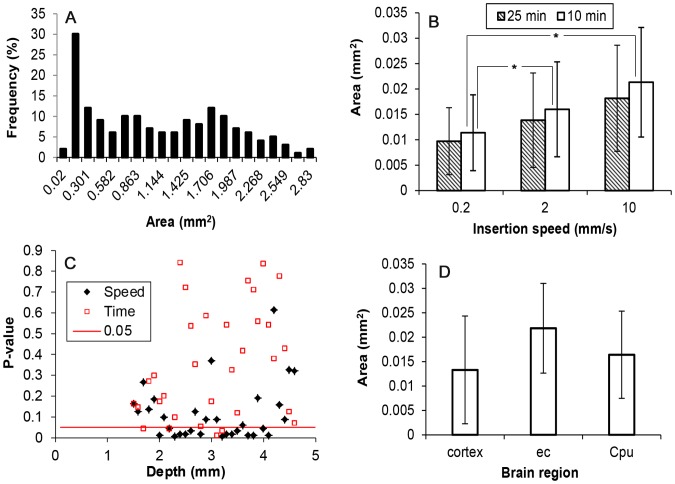
Figure 9. Variation of hole measurements.
A) histogram showing non-Gaussian distribution of the hole areas for 10 mm/s needle insertion speed and fixation after 10 min (combined data from 4 needle tracks, 161 total hole measurements); B) average hole areas for the three insertion speeds and the two fixation time points evaluated for depths greater than 1.4 mm. Each bar corresponds to the average of n = 144 hole measurements. Significant difference with 10 mm/s is noted by *; C) analysis of variance to evaluate the influence of insertion speeds (0.2, 2, and 10 mm/s) and the influence of fixation time point (10 and 25 min). p-value is plotted for varying insertion depths; D) average area of holes for main tissue regions along the needle track. Each average value was significantly different from each other. Each bar corresponds to the average of n = 336, n = 48, and n = 504 measurements for cortex, external capsule (ec) and caudate putamen (CPu) regions, respectively. For cortex, points between 1.4 and 2.7 mm depth were considered. For external capsule, points at depth 2.8 mm and 2.9 mm were considered. For caudate putamen, points at depth higher than 2.9 mm were considered. Bars represent ±1 standard deviation.

