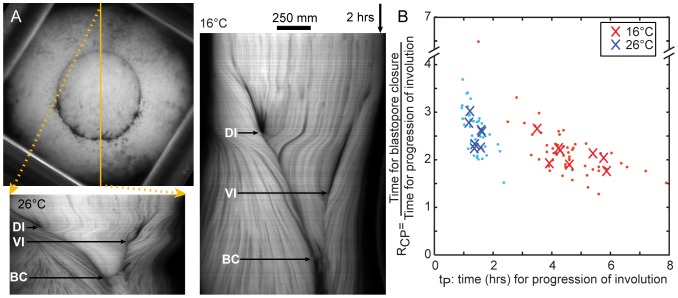
Figure 2. Blastopore closure at high and low temperatures.
(A) Upper: vegetal view of an embryo showing the blastopore soon after the start of dorsal superficial involution. Lower left: kymograph of blastopore closure at 26°C, taken along the yellow line from the dorsal side to the ventral side, showing the points when dorsal (DI) and ventral (VI) superficial involution begin, and when the blastopore closes (BC). Right: kymograph taken along a line from the dorsal to the ventral side at 16°C. (B) The ratio (RCP) of the time for blastopore closure to the time for dorsal-to-ventral progression of involution versus the time (tP) for dorsal-to-ventral progression of involution. Dots indicate individual embryos. X's indicate medians for clutches (4 to 8 embryos each).

