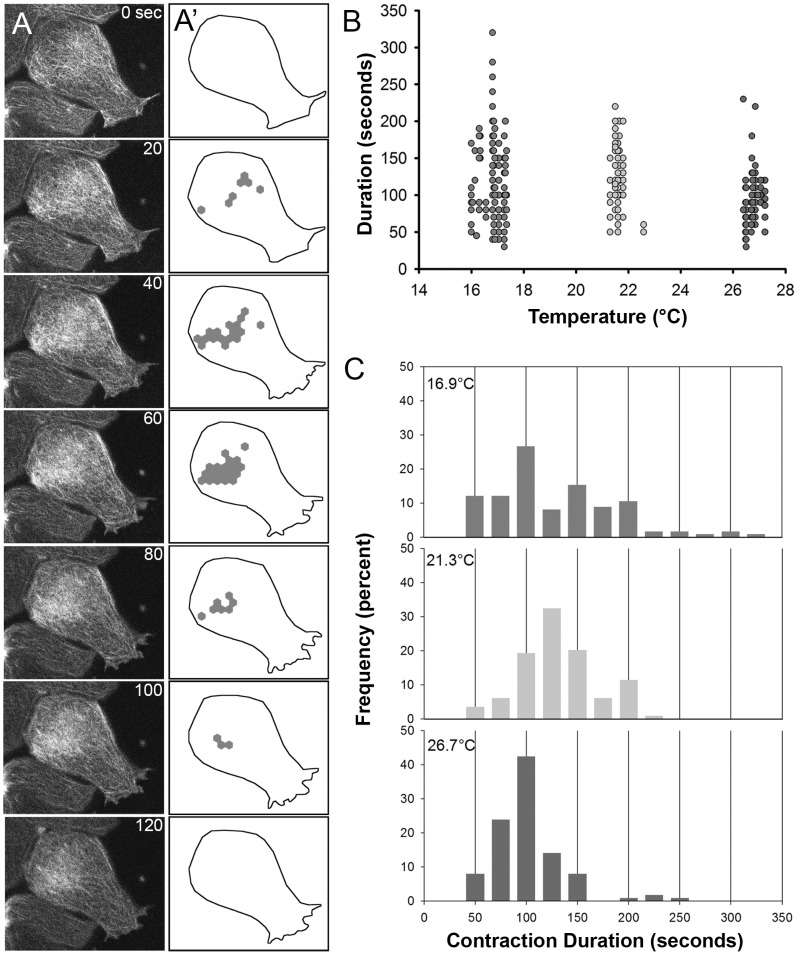
Figure 4. Duration of actomyosin contractions depends on temperature.
(A) Sequential frames from a representative time-lapse sequence collected from the basal cortex of an animal cap ectoderm explant cultured on fibronectin-coated glass substrate. F-actin dynamics are revealed in cells expressing the actin-binding domain from moesin coupled to EGFP (moe-GFP) (left column). This sample collected at 16°C. (A′) Schematic of frames matching those in (A) highlighting the cell outline (dotted line) and hexagonal regions of the cell cortex identified as “F-actin contractions.” Regions are categorized as contractions when their integrated intensities are 50% greater than the mean intensity of the basal cell cortex. (B) Duration of individual F-actin contractions across the three temperature regimes. (C) Frequency distribution of the duration F-actin contractions at three temperatures. Note abundant short duration contractions at the low temperature regime.

