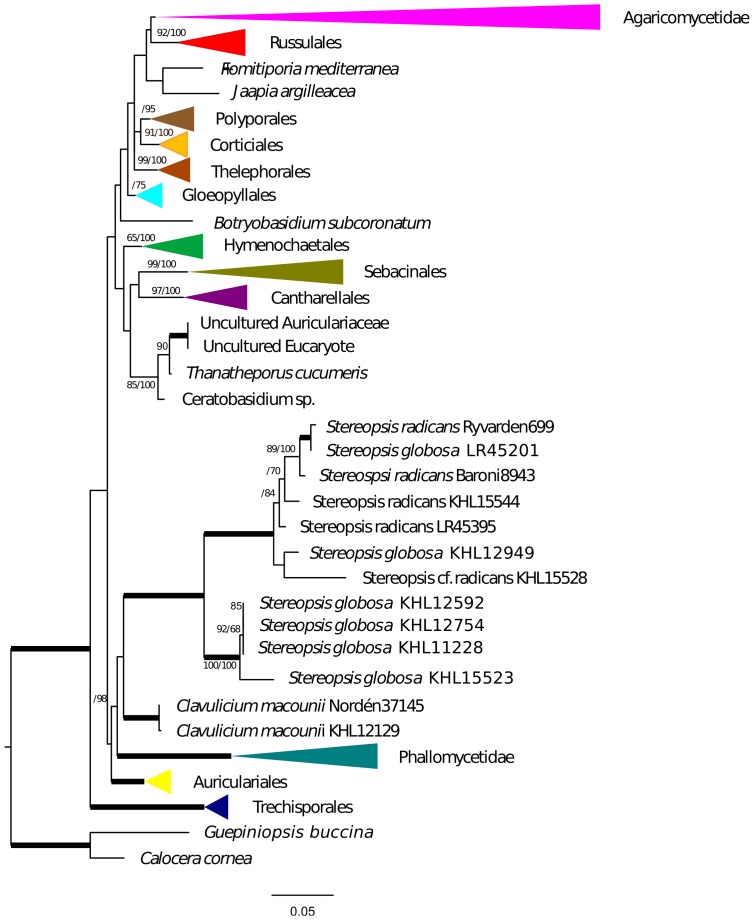
Figure 4. SSU phylogeny.
Maximum likelihood tree of nSSU with Bootstrap/Bayesian frequencies as a percentage shown above branches. Thick branches receive full support of both Bayesian frequencies and Bootstrap. The collapsed and colored groups represent current orders and subclasses of the Agaricomycetes.

