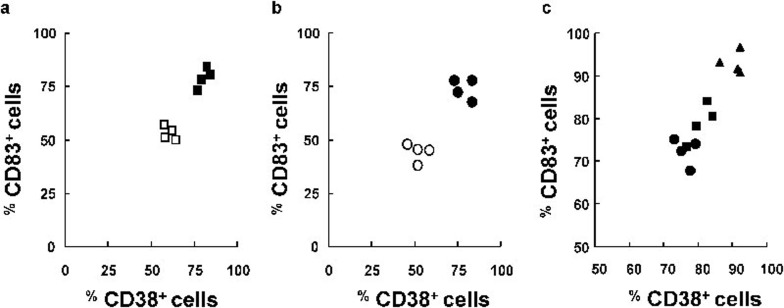
Figure 4.
Comparative analysis of CD83 and CD38 surface expression. Immature DCs were treated for 48 h in the presence of the indicated stimuli, and the expression of CD83 and CD38 was assessed by FACS analysis of DCs by double-staining with CD83 and CD38-specific mAb or control isotype-matched mAb. The percentages of cells expressing CD83+ and CD38+ are shown for TLR-stimulated DCs (open symbols; n=4) or DCs treated with a combine of IFN and TLR agonists (filled symbols; n=4). The TLR agonists are indicated as follows: (a) LPS (▪), (b) poly(I:C) (•) or (c) LPS + poly(I:C) (▴). DC, dendritic cell; IFN, interferon; LPS, lipopolysaccharide; mAb, monoclonal antibody; TLR, Toll-like receptor.

