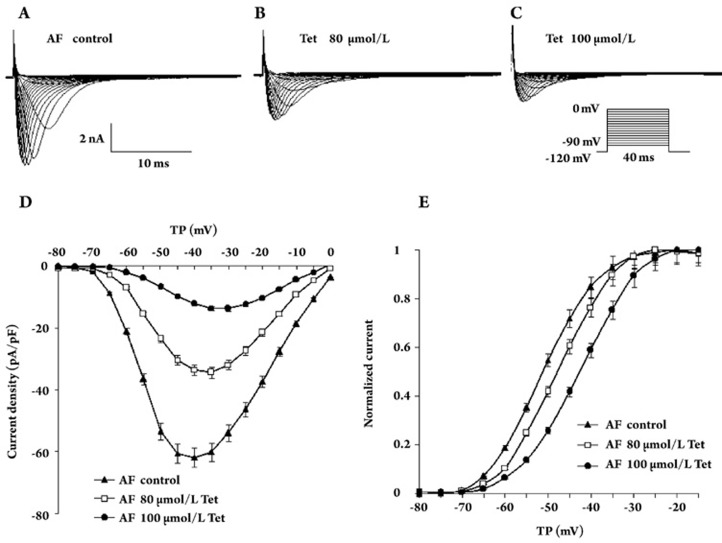
Figure 2.
Effects of Tet on INa density in human AF myocytes. (A–C) Representative sodium currents recorded from AF cells before and after incubation with 80 μmol/L and 100 μmol/L Tet. Currents were recorded at test potentials between −90 mV and 0 mV with 5 mV depolarizing steps. (D) I–V relation curves of INa densities in control, 80 μmol/L (n=8, P<0.01) and 100 μmol/L (n=7, P<0.01) Tet. (F) The voltage-dependent activation curves are shifted to more positive voltages by Tet in AF cells. The V1/2 was as follows: control, −51.5±0.4 mV, 80 μmol/L Tet, −47.7±0.4 mV (n=8, P<0.05 vs control), 100 μmol/L Tet, −42.5±0.3 mV (n=8, P<0.01 vs control). TP: test potential.

