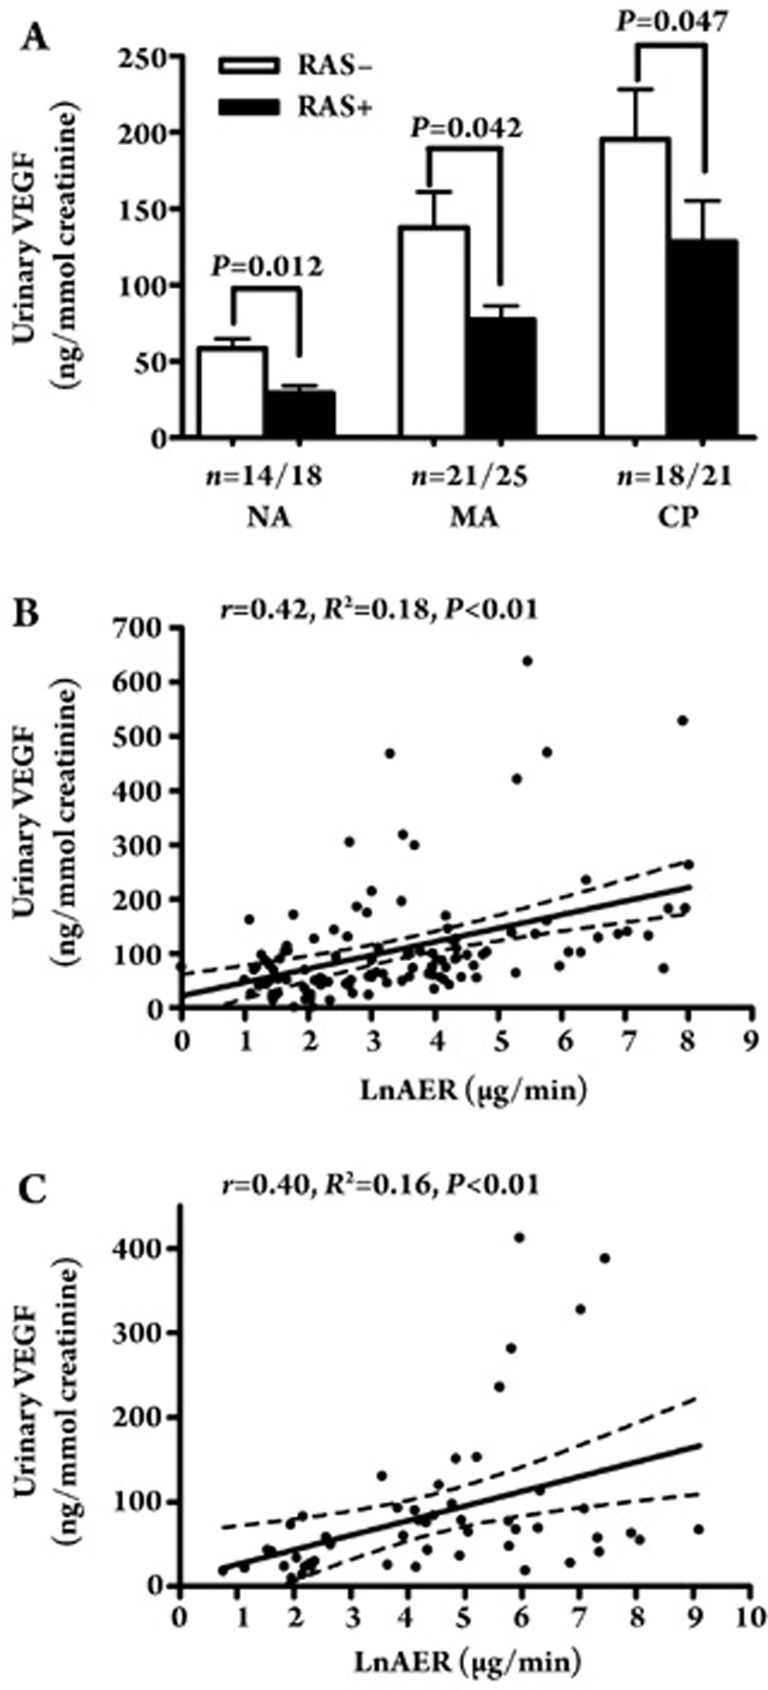
Figure 2.
(A) Comparison of uVEGF levels in hypertensive type 2 diabetic patients between RAS positive and negative group in the NA, MA, and CP groups. (B) A correlation between uVEGF level and LnAER in RAS positive group (r=0.42, P<0.01). (C) A correlation between uVEGF level and LnAER in RAS negative group (r=0.40, P<0.01).

