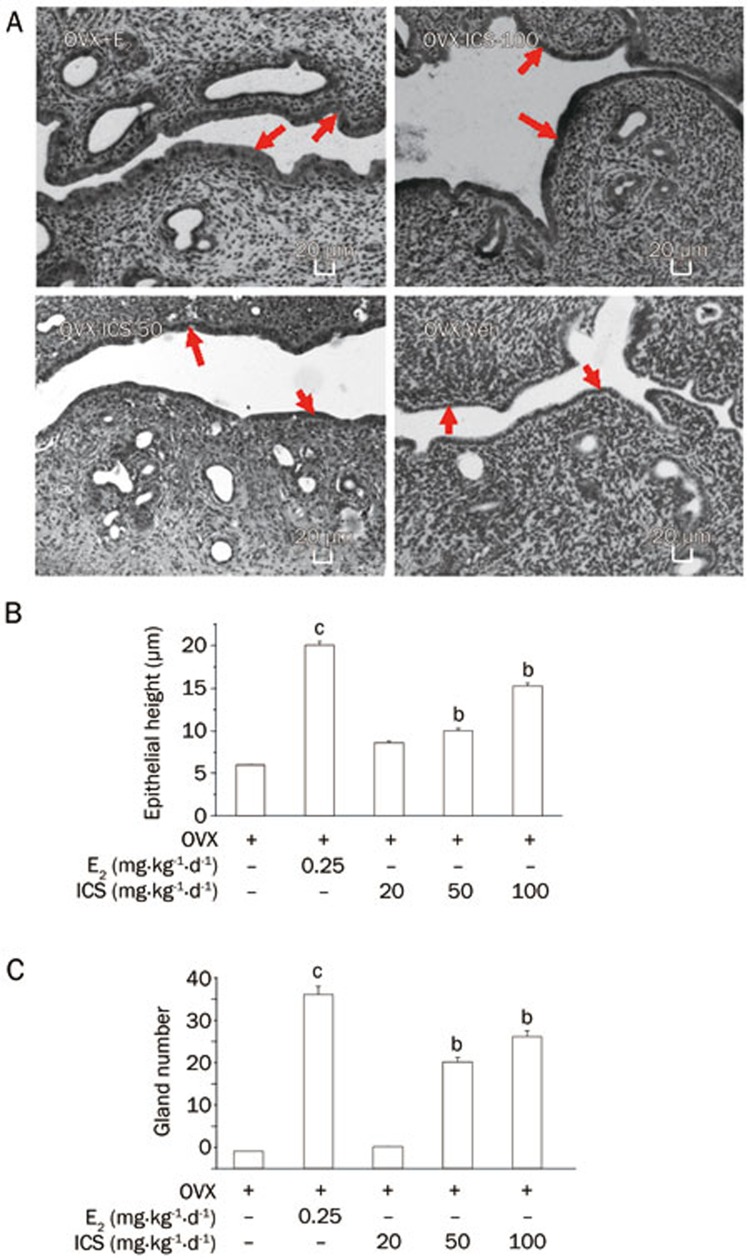
Figure 1.
Uterine structure analysis. (A) Representative micrographs of sections of uteri of OVX+E2, OVX+ICS-100, OVX+ICS-50, and OVX+Veh rats. The arrow indicated area was the uterine epithelial layer (HE staining, ×100). (B) Average urterine epithelial cell height, and (C) average uterine gland numbers of experimental groups. Results are means±SEM. n=8 rats/group. bP<0.05, cP<0.01 vs OVX+Veh group.

