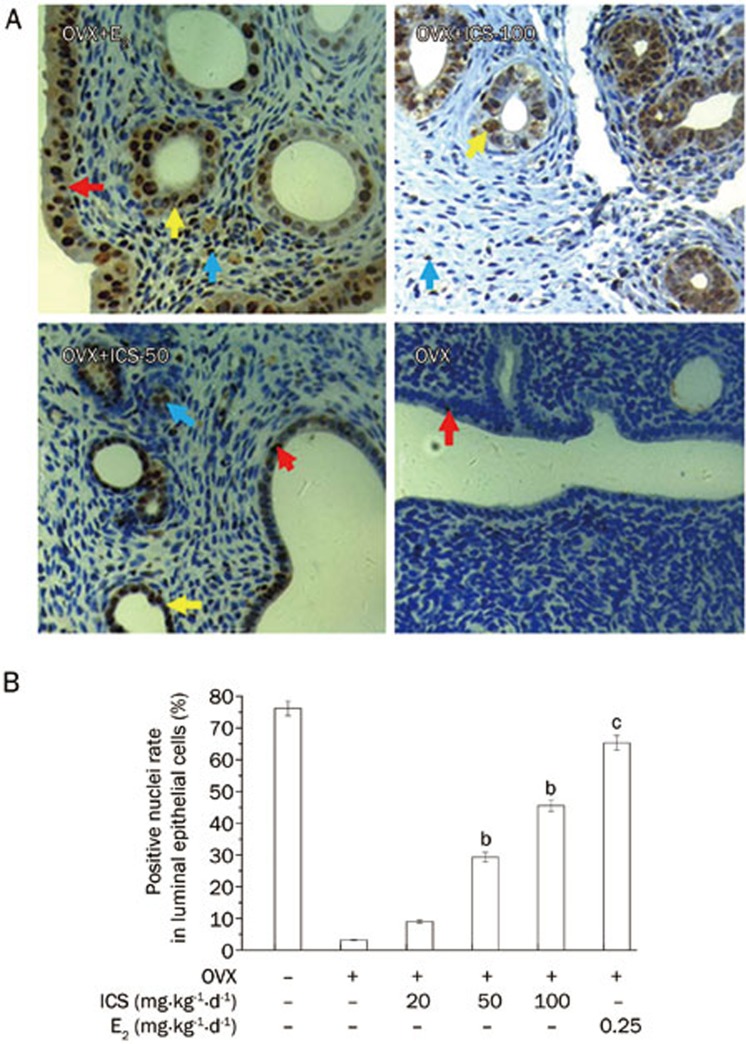
Figure 2.
Immunohistochemical analysis of PCNA expression in uteri of OVX rats. (A) Representative micrographs of PCNA expression (brown staining in nuclei) in uteri of OVX+E2, OVX+ICS-50, OVX+ICS-100, and OVX+Veh rats. The color arrows indicated the positive nuclei in different cells: luminal epithelial cells (red arrows), glandular epithelial cells (yellow arrows) and stromal cells (blue arrows) in uterine (×400). (B) Mean percent ratios of number of PCNA positive nuclei vs total number of the luminal epithelial cells nuclei in uteri. Results are means±SEM. n=8 rats/group. bP<0.05, cP<0.01 vs OVX+Veh group.

