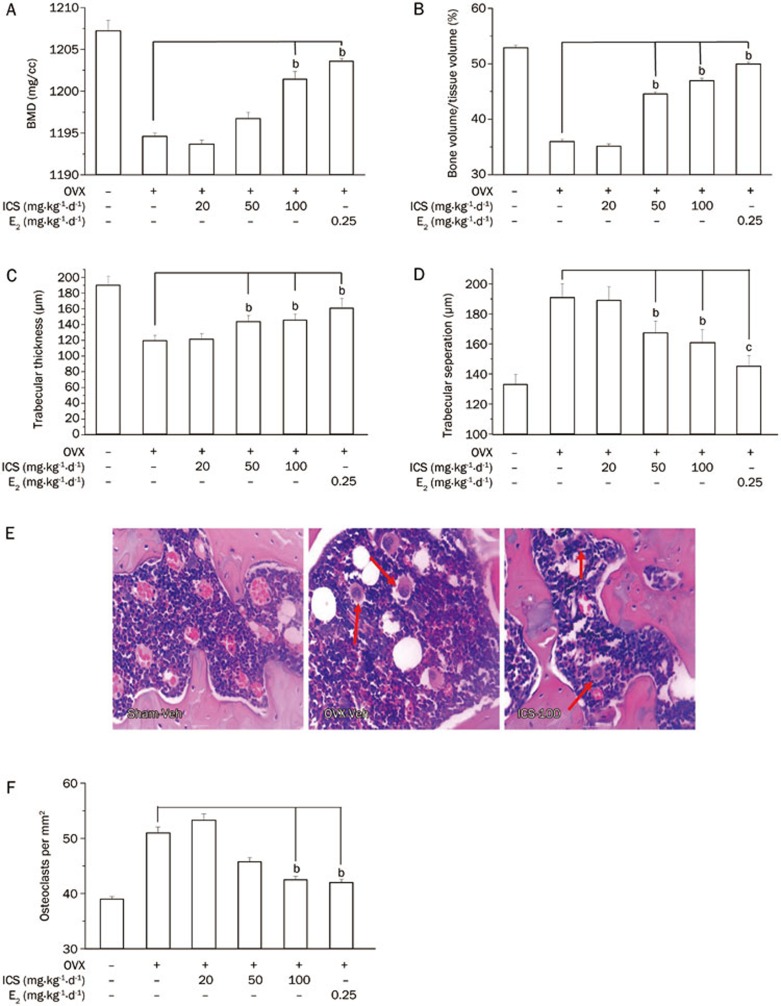
Figure 3.
Histological analysis of the bone in the right distal femora, in Sham+Veh and OVX+Veh rats, as well as in OVX rats treated with E2 or ICS for 5 weeks. The femora were collected 7 weeks after OVX and 3D bone structure parameters were measured by Micro-CT. (A) Total bone mineral density (BMD); (B) Total bone volume to tissue volume ratios (BV/TV); (C) Trabecular thickness (Tb.Th); (D) Trabecular separation (Tb.Sp). (E) Representative micrographs to show distribution of multinucleated osteoclasts in bone (H&E staining, red arrow indicated); and (F) Average of osteoclast density in bone (×400). Results are means±SEM. n=8 rats/group. bP<0.05 compared to OVX+Veh group.

