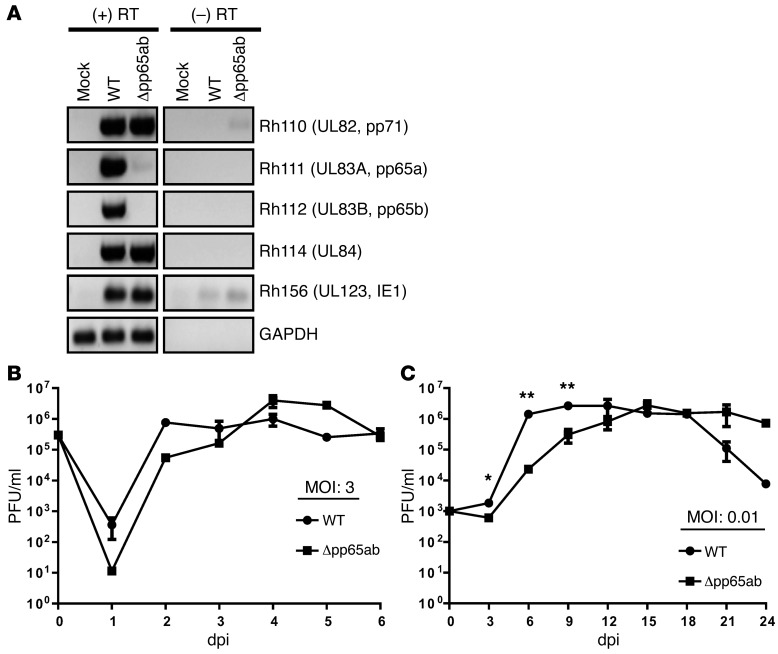
Figure 1. Characterization of RhCMVΔpp65ab in vitro.
(A) RT-PCR results for cDNA of infected TRFs showing the expression of pp65a (Rh111) and pp65b (Rh112) and their neighboring ORFs Rh110 (pp71) and Rh114. IE1 and GAPDH were included as controls. (B) Single-step (MOI of 3) and (C) multistep (MOI of 0.01) growth curves of RhCMV WT and RhCMVΔpp65ab on TRFs. *P < 0.05, Student’s t test; **P < 0.01, Student’s t test.

