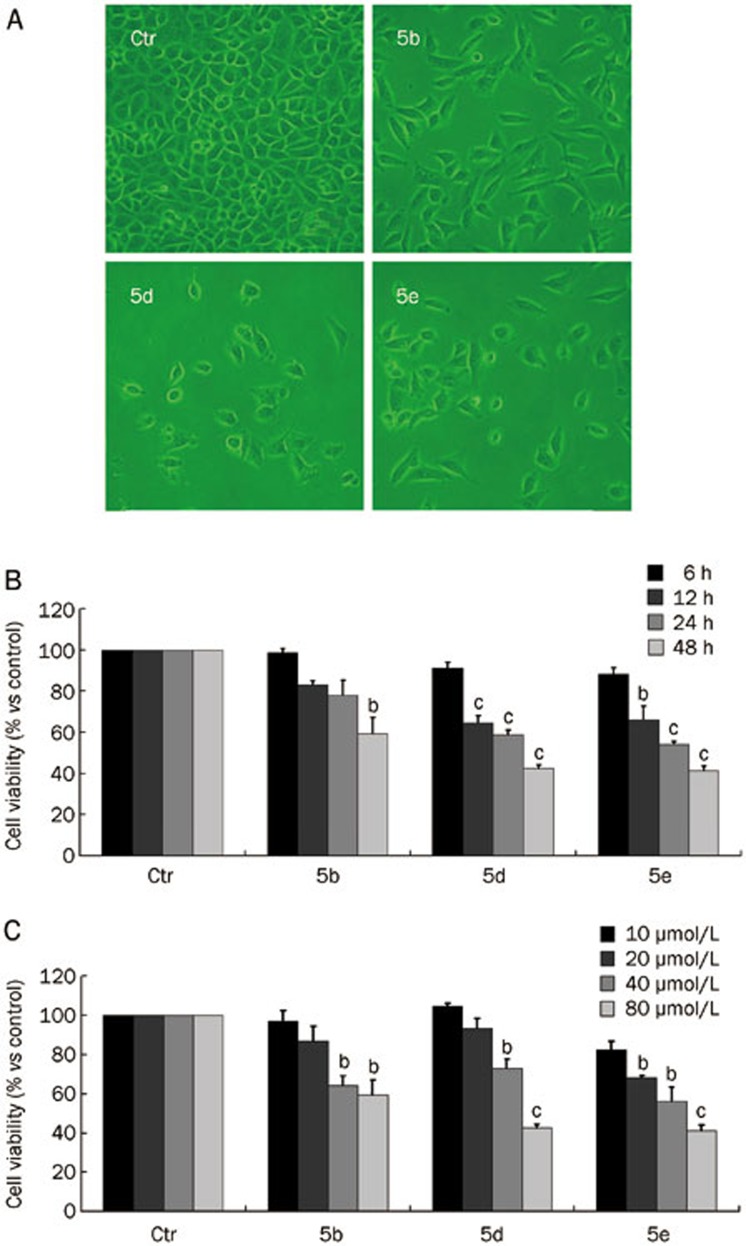
Figure 2.
(A) Morphology of A549 cells after treatment with compounds 5b, 5d, and 5e (80 μmol/L) for 48 h, as obtained using a phase contrast microscope (×200). (B) Viability of A549 cells after treatment with compounds 5b, 5d and 5e (80 μmol/L) for various times (6, 12, 24, and 48 h). (C) Viability of A549 cells after treatment with 10, 20, 40, and 80 μmol/L compounds 5b, 5d, 5e for 48 h (bP<0.05, cP<0.01 vs control group; n=3).

