Figure 5.
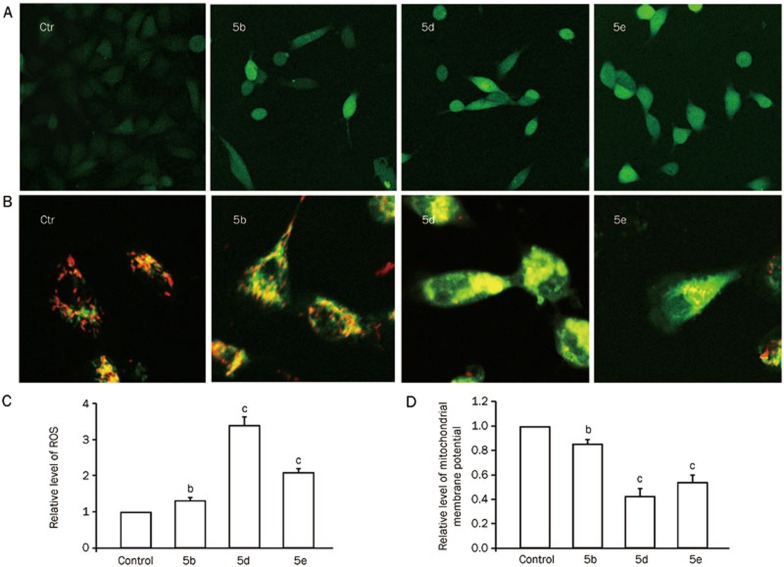
(A) Effects of compounds 5b, 5d, and 5e (80 μmol/L) on the level of ROS in A549 cells at 48 h. Fluorescent micrographs show the relative intensity of ROS. (B) Effects of compounds 5b, 5d, and 5e (80 μmol/L) on the mitochondrial membrane potential (MMP) at 48 h. (C) The relative amount of ROS in A549 cells. (D) Relative MMP was quantified as the ratio of red/green fluorescence intensity per cell (bP<0.05, cP<0.01 vs control group; n=3).

