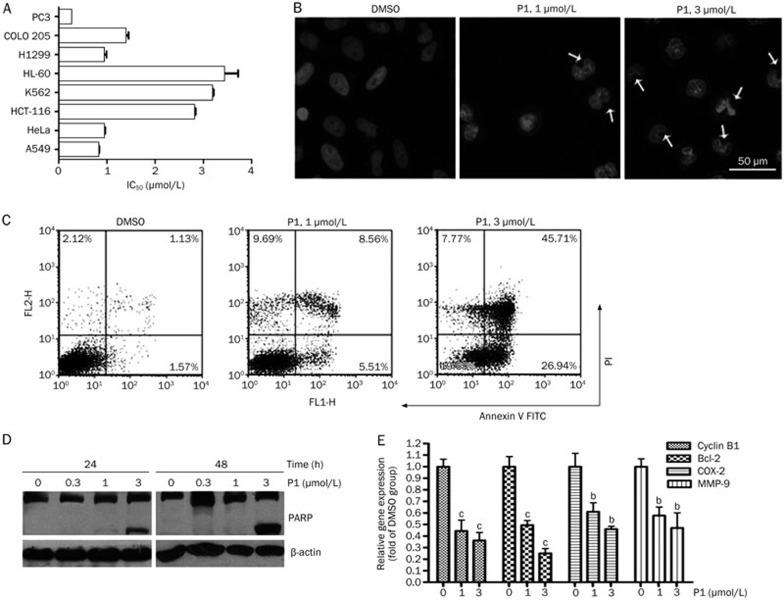
Figure 2.
P1 induced apoptotic cell death. (A) IC50 of P1 in eight different cancer cell lines. SRB assay was conducted after 72 h of treatment. (B) DAPI staining of HeLa cells after P1 treatment for 24 h. (C) Annexin V-FITC staining of HeLa cells after P1 treatment for 24 h. (D) PARP cleavage induced by P1 after treatment for the indicated times. (E) The effect of P1 on expression of NF-κB-regulated genes in HeLa cells after treatment for 12 h. Mean±SD. n=3. bP<0.05, cP<0.01 vs the control.

