Figure 6.
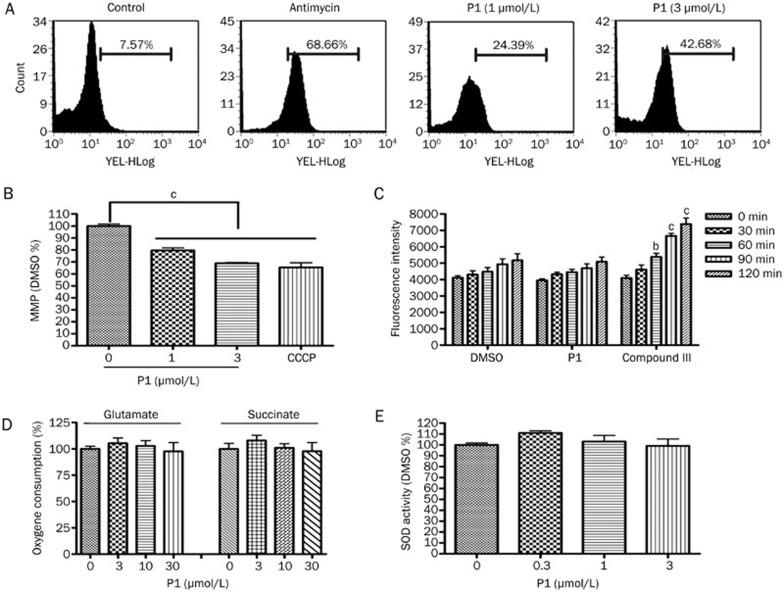
P1-induced mitochondrial ROS. (A) Mitochondrial ROS were measured using MitoSOX staining after treatment with P1 or antimycin (20 μmol/L) for 3 h. (B) MMP was measured using JC-1 staining after treatment with P1 or CCCP (5 μmol/L) for 1 h. (C) The effect of 10 μmol/L P1 on free radical signal production in vitro. Compound III, a isoquinoline-1,3,4-trione derivative, was used as a positive control. (D) The effect of P1 on the respiration of isolated mitochondria from HeLa cells. The results are presented as fold-changes compared with the DMSO group. (E) SOD activity was measured after treatment with P1 for 3 h. Mean±SD. n=3. bP<0.05, cP<0.01 vs the control.

