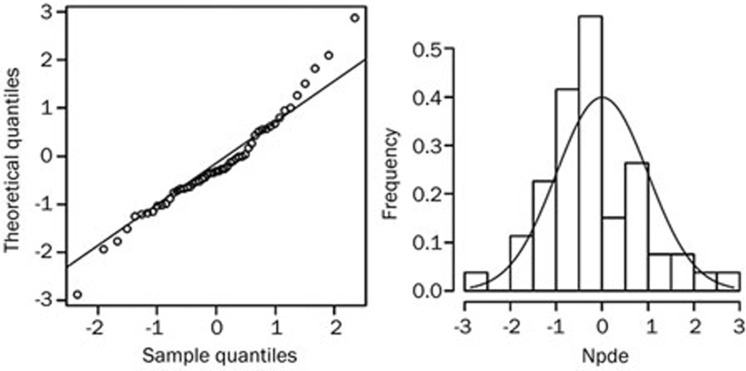
Figure 4.
Normalized prediction distribution error (NPDE) analysis of the developed model in 10 patients. NPDE: QQ-plot of the distribution of the NPDE versus the theoretical N(0,1) distribution. Histogram of the distribution of the NPDE, with the density of the standard Gaussian distribution overlaid.

