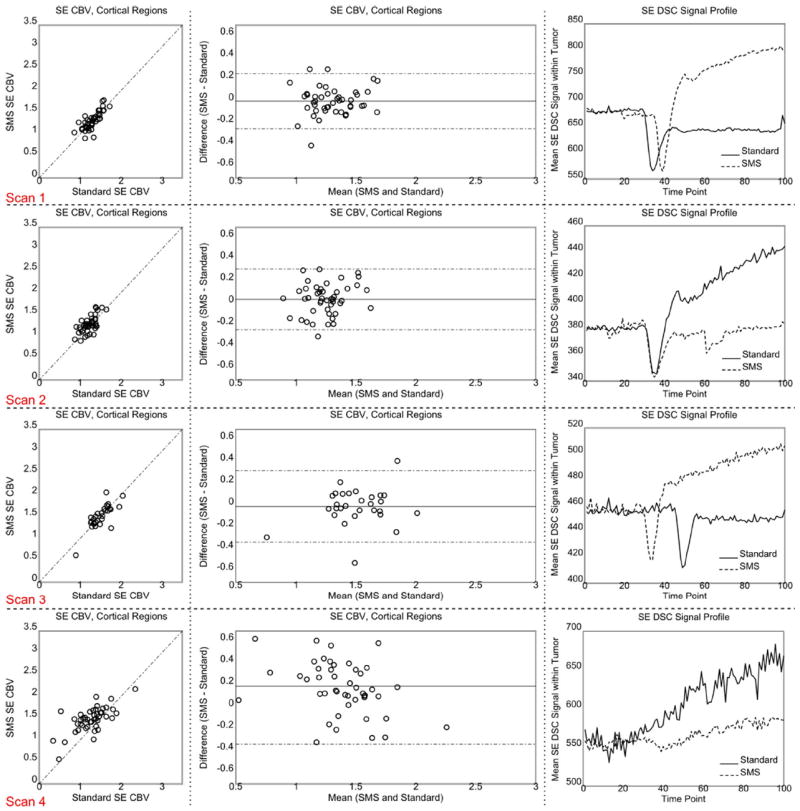
FIG. 5.

Scatter and Bland-Altman plots generated from SE CBV measurements within the healthy tissues (first two left columns) and GE DSC signal profile within the enhancing tumor (right column). The dotted lines of the Bland-Altman plot in the center column show the 95% confidence interval. The SMS signal in the signal profile plots on the right was scaled to make the baselines similar. The time shift of the peak arises from manual timing of CA injection. Each row corresponds to one scan. [Color figure can be viewed in the online issue, which is available at wileyonlinelibrary.com.]
