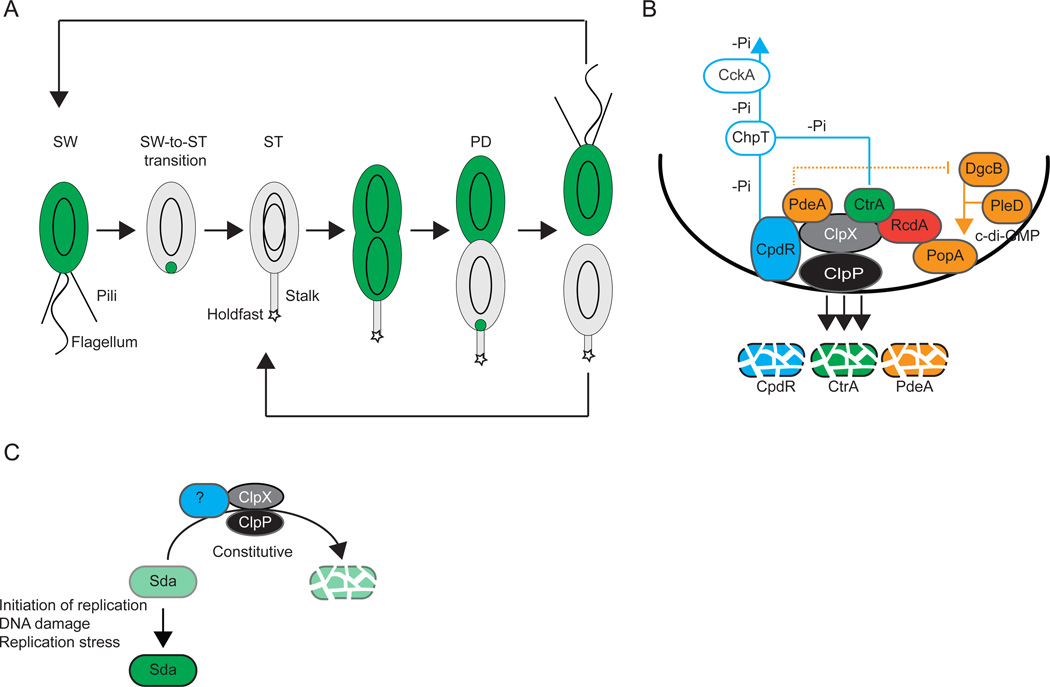
Figure 3. Destruction of regulatory proteins by regulated proteolysis.
(A) Schematic of the C. crescentus cell cycle including the presence and localization of CtrA (green). Polar appendages, swarmer (SW), stalked (ST) and predivisional (PD) cells are indicated. Black ovoids indicate chromosomes.
(B) Recruitment of ClpXP and CtrA to the incipient ST cell pole in C. crescentus. Polarly localized proteins are indicated in full colors. Blue lines indicate the reverse phosphate (-Pi) flow from CpdR and CtrA to ChpT and CckA. CpdR recruits ClpXP and functions as an adaptor for PdeA degradation by ClpXP. RcdA recruits CtrA but does not appear to function as an adaptor for ClpXP degradation of CtrA. Proteins involved in c-di-GMP metabolism and binding are shown in orange. The stippled orange line indicates the inhibition by PdeA of DgcB activity until PdeA degradation. The orange line indicates c-di-GMP synthesized by DgcB and PleD that binds to PopA.
(C) Regulation of Sda accumulation in response to chromosome status. Levels of green indicate levels of Sda accumulation. The putative adaptor (blue) required for Sda degradation by ClpXP is not known.

