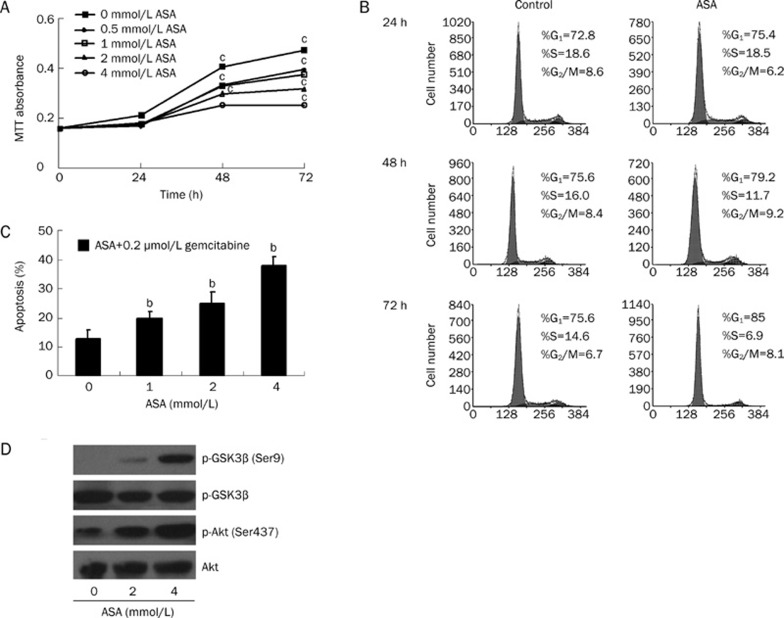
Figure 7.
(A) Capan-1 cells were treated with various concentrations of ASA and cell growth was determined using the MTT assay at 24, 48, and 72 h. Results represent the mean absorbance at 570 nm of three different experiments with quintuple wells. SEM bars are not included for clarity. cP<0.01 compared with untreated cells at corresponding time points. (B) Capan-1 cells were treated with or without 4 mmol/L ASA for various time and cell cycle analysis was performed using the fluorescent cytometry. (C) Cells were treated with various concentrations of ASA in combination with 0.2 μmol/L gemctitabine for 24 h. Apoptosis was then determined by Hoechst 33258 assay. bP<0.05 compared with 0.2 μmol/L gemcitabine-treated cells. (D) The effect of ASA on Akt/GSK-3β signaling pathway in Capan-1 cells.

