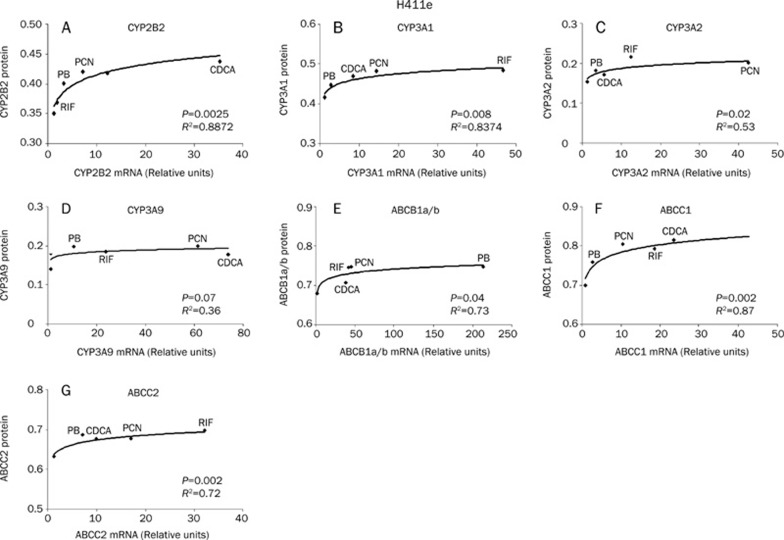
Figure 7.
Relationship between mRNA and protein expression. Correlation between mRNA and protein expression in H411e cells for CYP2B2 (A), CYP3A1 (B), CYP3A2 (C), CYP3A9 (D), ABCB1a/b (E), ABCC1 (F), and ABCC2 (G). A best fit to the data was observed by logarithmic regression for all CYPs and transporters.

