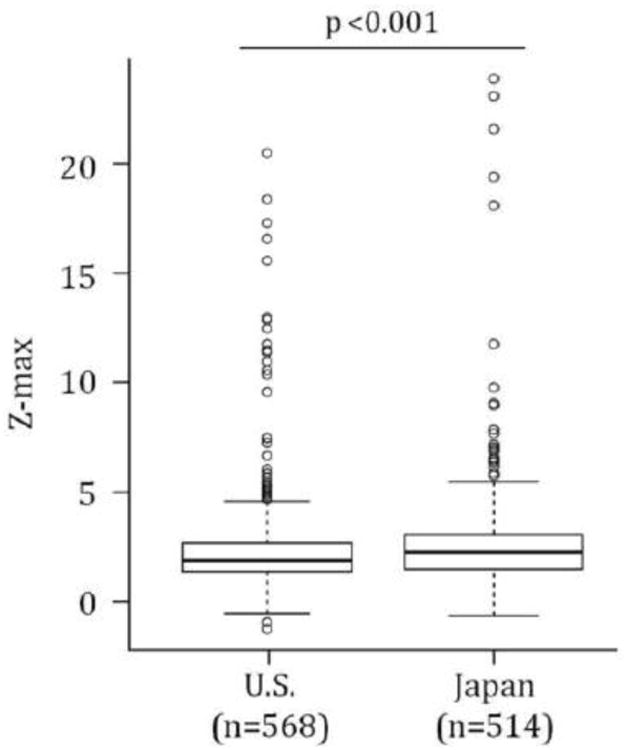
Fig 1.

Coronary artery outcomes for Kawasaki disease subjects in the U.S. and Japan calculated using the Haycock BSA equation and Dallaire equation for Z-max. Box plots represent the median and 25-75th percentiles, whiskers represent the 5-95%, and outliers are shown as open circles.
