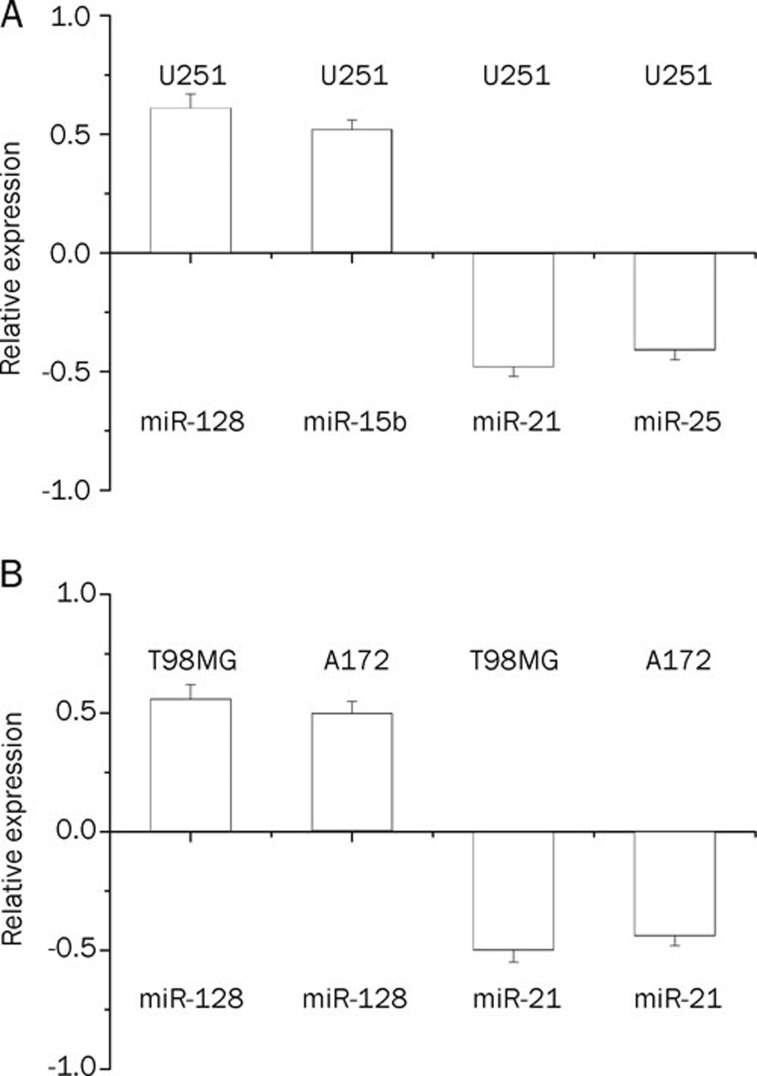
Figure 2.
Validation of miRNA expression by quantitative real-time PCR. (A) The expressions of up-regulated miR-128 and miR-15b, as well as the down-regulated miR-21 and miR-25 in U251 cells were verified. The results of quantitative RT-PCR for the four selected miRNAs were consistent with the miRNA array results. (B) The expressions of miR-128 and miR-21 in human T98MG and A172 glioma cells were determined. The consistent results in these two giloma cells were observed as compared to U251 cells. The cells were treated with 12 μg/mL Rh2 for 24 h. Data were expressed as means±SEM of 3 independent experiments. Fold change of miRNA expression was presented in log 2 scale.

