Figure 1.
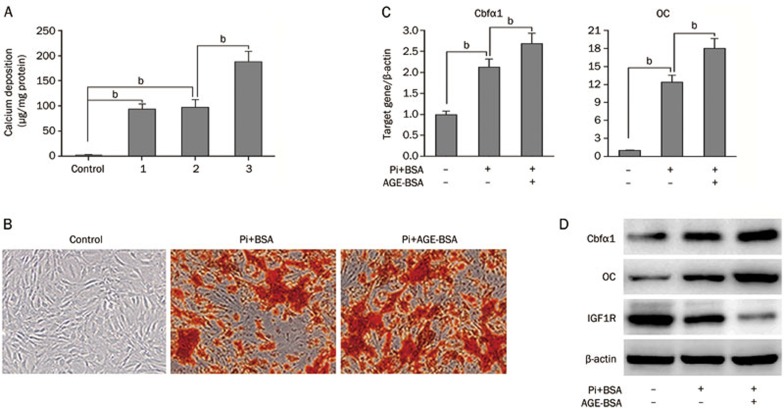
AGEs accelerate the progression of calcification in HASMCs. (A) HASMCs were cultured in the following four groups for 7 days: control group (growth medium), group 1 (calcification medium only), group 2 (calcification medium+BSA), and group 3 (calcification medium+AGE-BSA). Extracellular calcium measurements were performed using the QuantiChrome Calcium Assay, and the data were normalized using the total protein concentration. (B) Representative images of alizarin red staining in microscopic views (×100) are shown. (C) qPCR analysis of mRNA levels of bone-related molecules, Cbfα1 and OC, in HASMCs treated with AGEs for 7 d. (D) Western blot analysis of OC, Cbfα1, and IGF1R protein expression; β-actin was used as a control for protein loading. For the bar graphs, data from three independent experiments were included for statistical analysis. bP<0.05.

