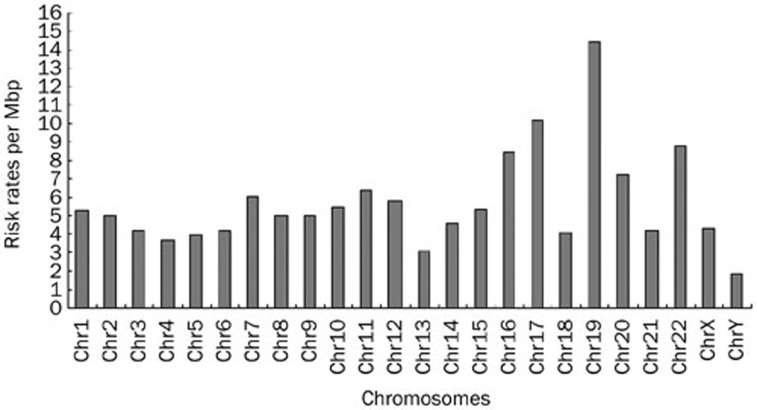
Figure 4.
The risk specificity value are used to measure the ratio of recognizing the potential sites. From the result, the expected risk specificity under null hypothesis and the actural risk specificity correlate well. And it also can be found that the chromosome 19, 17, 20, 16 have relatively higher risks. Similar result has also been found in the HIV integration sites preference31.

