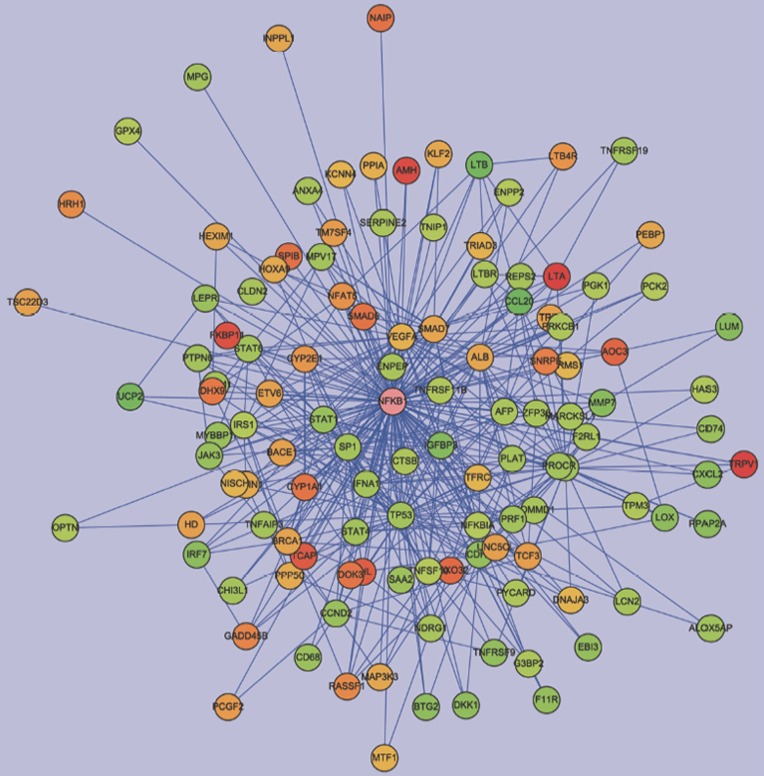
Figure 2.
Network analysis of expression profiles of 10 μmol/L AA in HK-2 cells. We constructed the interaction network by BiblioSphere Pathway Edition software which was selected the genes with fold changes >2.0 and false discovery rates <0.05 after 10 μmol/L AA treatment. Intensity of nodes for regulated genes and NFKB1 are color-coded according to their log2 expression values in gradient with red and green indicating the degree of gene upregulation or downregulation, respectively. As shown, NF-κB played a central role in the network.

