Figure 4.
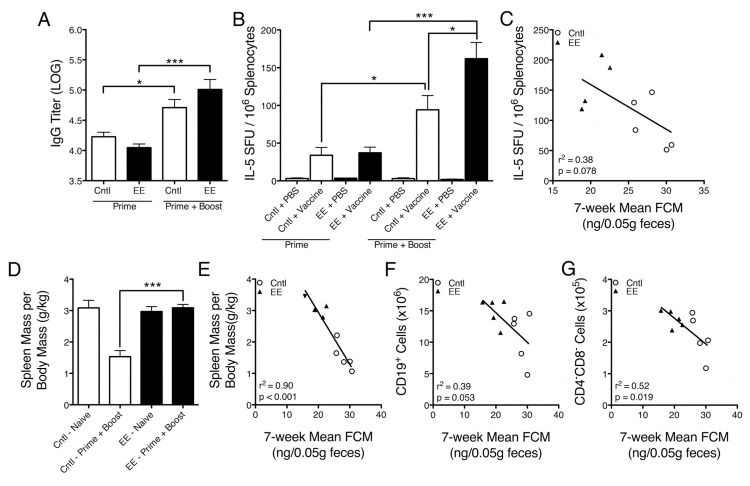
Effects of EE caging on primary and secondary vaccine responses and spleen composition. (A) Influenza vaccine–specific IgG titers were measured in serum from mice vaccinated once (prime) or twice (boost) using an ELISA. In primed groups, EE mice had slightly lower IgG titers than control-caged mice (p = 0.0943), whereas in boosted groups, EE mice had slightly higher IgG titers than controls (p = 0.1950), although neither difference was statistically significant. Control mice exhibited an increase in IgG titer, from prime to boost, of 11.4%, whereas EE mice exhibited an increase of 23.8% (control, p = 0.0138; EE, p = 0.0006). (B) 1 × 10⁶ splenocytes were stimulated with either PBS or vaccine for 24 h in an IL-5 ELISPOT assay. Primed animals showed no difference between caging groups, whereas splenocytes from boosted EE mice that were stimulated with vaccine had a significantly greater frequency of IL-5–secreting cells than boosted controls (p = 0.0493). The increase in frequency of IL-5–secreting cells from prime to boost was larger in EE mice (334.2%) than controls (177.9%) (control, p = 0.0230; EE, p = 0.0005). (C) A nonsignificant negative trend was observed between IL-5 production and mean FCM concentration (r2 = 0. 38, p = 0.0781). (D) Spleen mass per unit body mass was found to be significantly lower in boosted control-caged mice than boosted EE-caged mice (p = 0.0001). (E) A negative relationship was observed between mean FCM concentration and spleen mass per unit body mass in vaccine-boosted animals (r2 = 0.90, p < 0.0001). (F, G) Negative relationships were also observed between mean FCM concentration and CD19+ B cell number and CD4−CD8− lymphocyte number (CD19+, r2 = 0.39, p = 0.0533; CD4−CD8−, r2 = 0.52, p = 0.0190). Data are mean ± SEM. *p < 0.05, ***p < 0.001.

