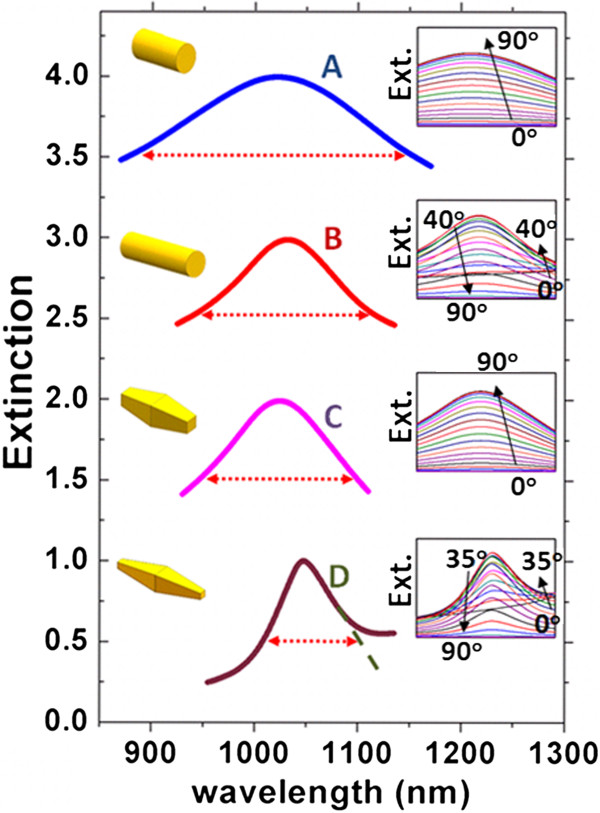
Figure 4.
Incident angle-averaged extinction spectra. Normalized incident angle-averaged extinction spectra for nanorods of types A, B, C, and D in the wavelength of interest, with surrounding medium of RI = 1.33. The red double arrows denote the fullwidth at half maximum linewidth of each peak. For the D curve, the extrapolation line is also shown. The curves are plotted in offset for clarity, with insets showing the schematics of the nanorods (left) and their angle-dependent extinction spectra (right).

