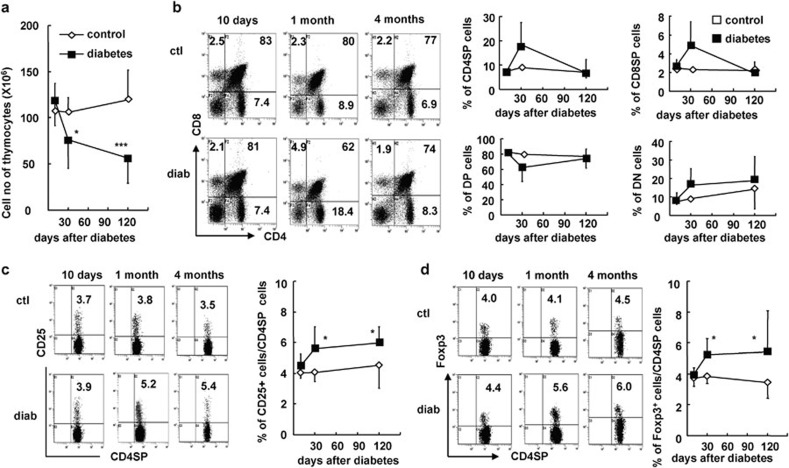
Figure 7.
The percentage of nTregs was increased in the thymuses of mice with diabetes. Thymocytes were freshly prepared at 10 days, 1 month and 4 months after the onset of diabetes and stained for CD4, CD8 and CD25/Foxp3. (a) Absolute numbers of thymocytes from control and diabetic mice at indicated time points. (b) Representative FACS staining for CD4 and CD8 on thymocytes (middle in upper panel) and the mean percentages of CD4SP, CD8SP, CD4CD8DP and CD4CD8DN cells in thymocytes (right in upper panel) at indicated time points. (c) Representative FACS staining for CD25 on gated CD4SP thymocytes (left in lower panel) from control and diabetic mice as well as the mean percentage of CD25+ Tregs out of total CD4SP cells (middle in lower panel) in the thymus at indicated time points. (d) Representative FACS staining for Foxp3 on gated CD4SP thymocytes as well as the mean percentage of Foxp3+ Tregs out of total CD4SP cells (right in lower panel) in the thymuses of control and diabetic mice at indicated time points. Data are shown as mean±s.d. (n=15), which is a summary of four independent experiments. *P<0.05, **P<0.01 and ***P<0.001, compared with the control mice. DN, double negative; DP, double positive; FACS, fluorescence-activated cell sorting; nTreg, naturally occurring regulatory T cell.

