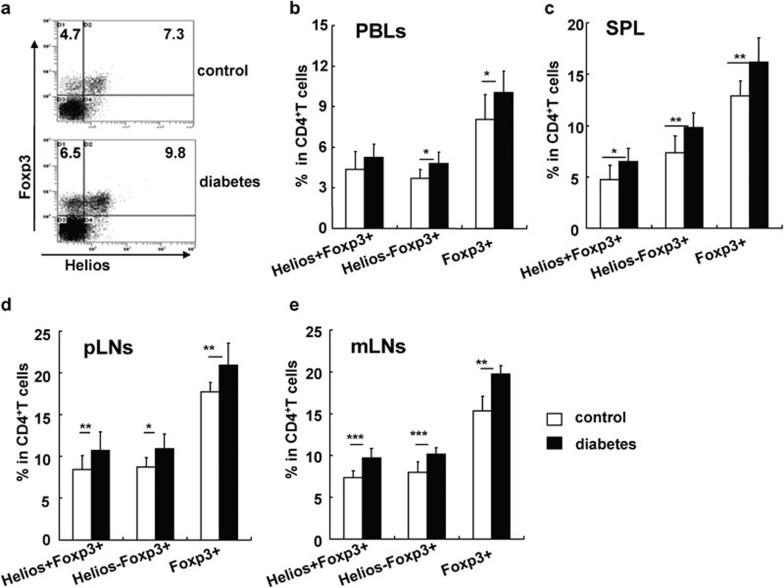
Figure 8.
Both nTregs and iTregs were increased in the periphery of mice with diabetes for 4 months. (a) Representative FACS staining for Helios and Foxp3 on gated CD4+ T cells. The percentages of Helios+Foxp3+ iTregs, Helios−Foxp3+ iTregs and Foxp3+ iTregs out of total CD4+ T cells in PBLs (b), the spleen (c), pLNs (d) and mLNs (e). Data are shown as mean±s.d. (n=10), for one representative out of three independent experiments. *P<0.05, **P<0.01 and ***P<0.001, compared with the indicated groups. FACS, fluorescence-activated cell sorting; iTreg, inducible regulatory T cell; mLN, mesenteric lymph node; nTreg, naturally occurring regulatory T cell; PBL, peripheral blood lymphocyte; pLN, peripheral lymph node; SPL, splenic-derived lymphocyte.

