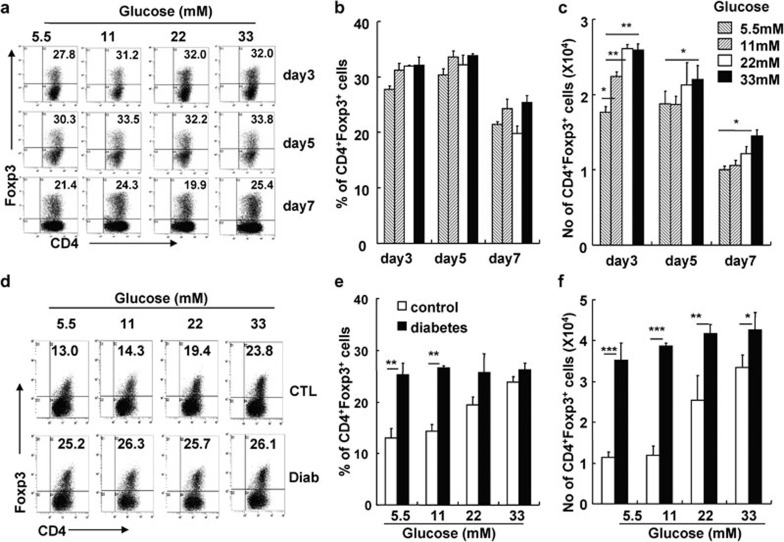
Figure 9.
Enhanced CD4+CD25+ iTreg induction under high glucose conditions and enhanced sensitivity of CD4+CD25− Teffs in diabetic mice to iTreg induction in vitro. Sorted CD4+CD25− T cells from Foxp3-GFP knock-in mice or the indicated mice were cultured with TGF-β in the presence of plate-bound anti-CD3 and soluble anti-CD28 mAbs for the indicated amount of time. Cells were harvested and stained for Foxp3. (a) One representative FACS staining for CD4 and Foxp3 on cultured CD4+CD25− T cells. The mean percentages (b) and cell numbers (c) of CD4+Foxp3+ Tregs were summarized. (d) Representative FACS staining for CD4 and Foxp3 on cultured CD4+CD25− T cells from control or diabetic mice. Summary of the mean percentages (e) and cell numbers (f) of CD4+Foxp3+ Tregs after CD4+CD25− T cells from control or diabetic mice were cultured for 5 days. Data are shown as mean±s.d. (n=6), for one representative out of two independent experiments. *P<0.05, **P<0.01 and ***P<0.001, compared with the indicated groups. CTL, control; FACS, fluorescence-activated cell sorting; GFP, green fluorescent protein; iTreg, inducible regulatory T cell; mAb, monoclonal antibody; TGF, transforming growth factor; Treg, regulatory T cell.

