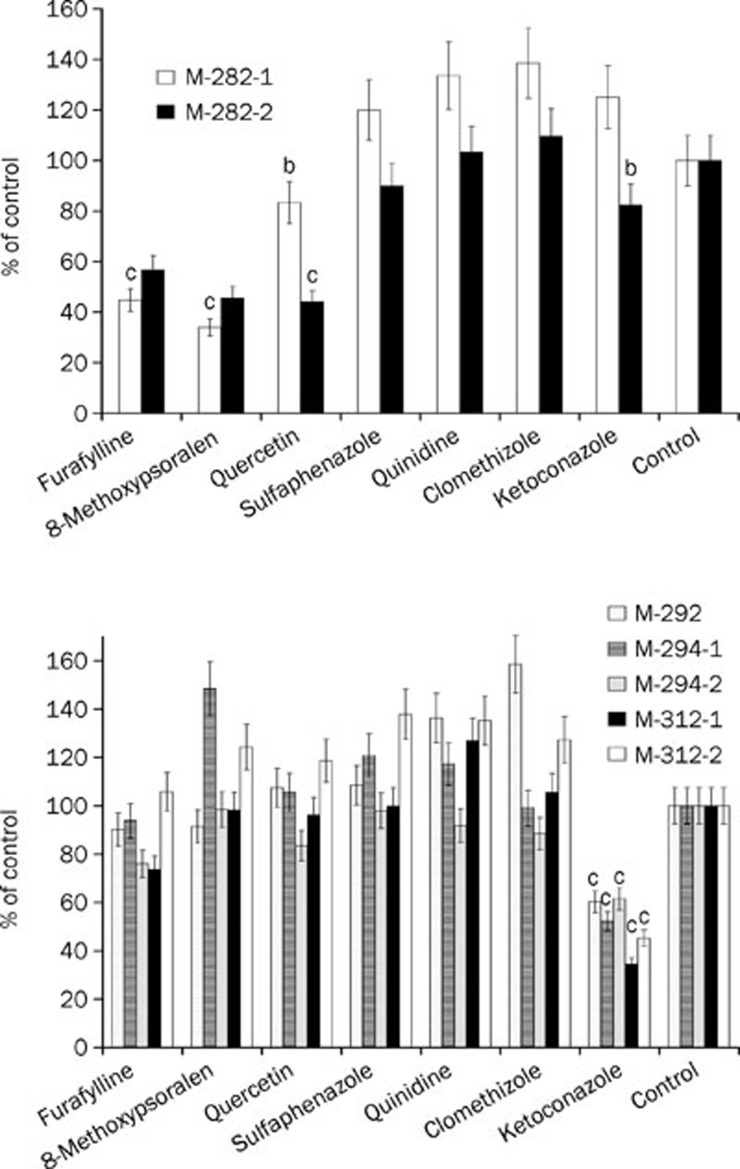
Figure 4.
Chemical inhibition of P450-catalyzed nuciferine metabolism by selective inhibitors of major P450 isozymes. The x-axis contains the names of the inhibitors, and the y-axis contains the percentage of metabolite formation compared with the control, which was normalized to 100%. In the control, the inhibitors were replaced by their corresponding solvents. Data are expressed as the mean and SD values. bP<0.05, cP<0.01 vs the control group.

