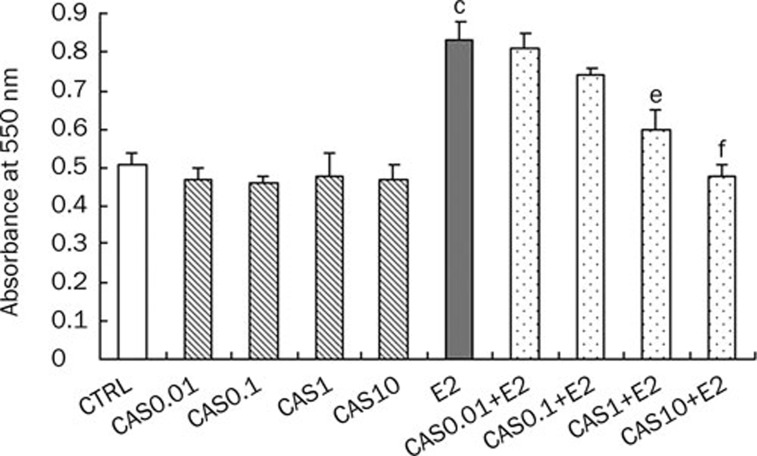
Figure 3.
Effects of casticin on pituitary cell proliferation. CAS0.01, CAS0.1, CAS1, and CAS10 represents the prolactin levels, expressed as the percentage of production by the controls, of pituitary cells treated with casticin for 48 h at doses of 0.01, 0.1, 1, and 10 μmol/L, respectively; E2 represents the prolactin level, expressed as the percentage of production by the controls, of pituitary cells stimulated with E2 (0.01 μmol/L) for 4 h; E2+CAS0.01, E2+CAS0.1, E2+CAS1, and E2+CAS10 represent prolactin levels, expressed as the percentage of production by the controls, of pituitary cells stimulated with E2 (0.01 μmol/L) for 4 h and then treated with casticin for 48 h at doses of 0.01, 0.1, 1, and 10 μmol/L, respectively. The data are represented as the mean±SD (n=10). cP<0.01 vs CTRL group, eP<0.05, fP<0.01 vs E2-treated group.

