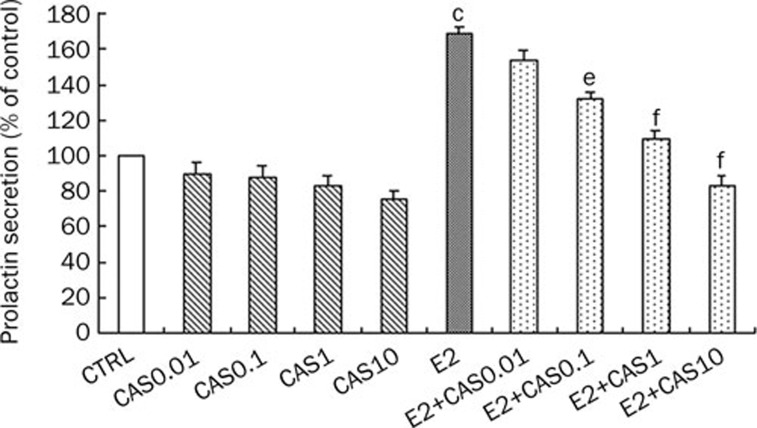
Figure 4.
Effects of casticin on prolactin secretion of normal and E2-treated pituitary cells. CAS0.01, CAS0.1, CAS1, and CAS10 represent the prolactin levels, expressed as the percentage of production by the controls, of pituitary cells treated with casticin for 48 h at doses of 0.01, 0.1, 1, and 10 μmol/L, respectively; E2 represents the prolactin level, expressed as the percentage of production by the controls, of pituitary cells stimulated with E2 (0.01 μmol/L) for 4 h; E2+CAS0.01, E2+CAS0.1, E2+CAS1, and E2+CAS10 represents the prolactin levels, expressed as the percentage of production by the controls, of pituitary cells stimulated with E2 (0.01 μmol/L) for 4 h and then treated with casticin for 48 h at doses of 0.01, 0.1, 1, and 10 μmol/L, respectively. The data are represented as the mean±SD (n=10). cP<0.01 vs CTRL group, eP<0.05, fP<0.01 vs E2-treated group.

