Figure 7.
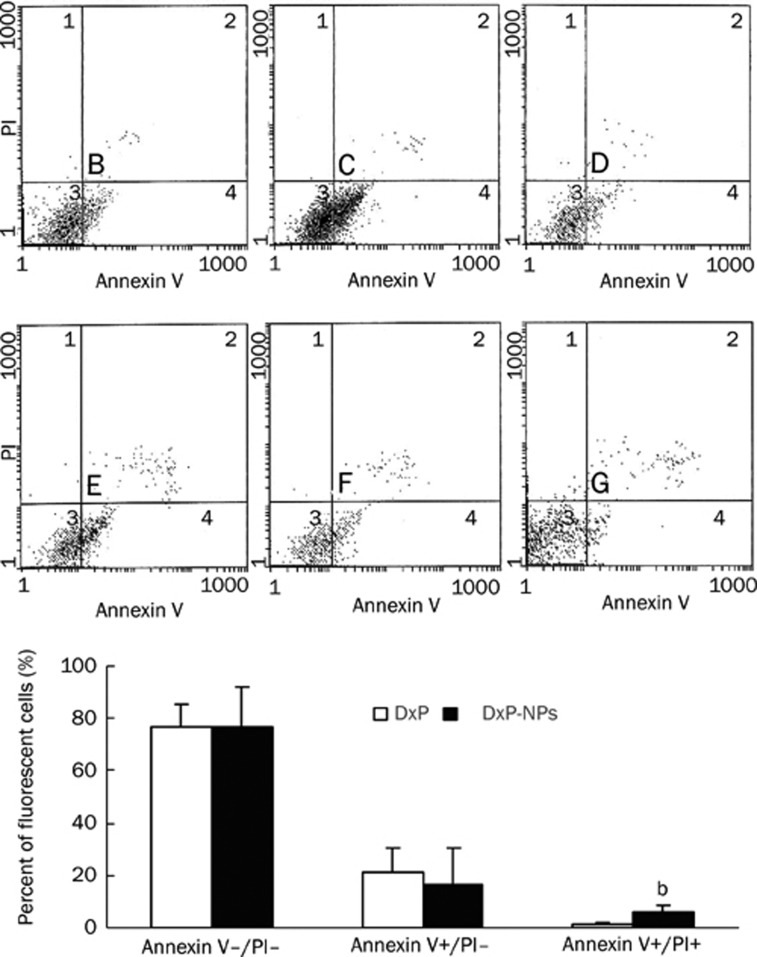
Apoptotic activity of DxP or TF-targeted DxP-NPs. The scatter plots (top) show that there was enhancement in apoptosis of SMCs treated with TF-targeted DxP-NPs (E, F, G) compared to that of free DxP (B, C, D). The percentage of the respective population is given in the quadrant. Quadrant 1, dead cells; Quadrant 2, late apoptotic cells; Quadrant 3, viable cells; Quadrant 4, early apoptotic cells. The bars (bottom) represent the percentage of fluorescent cells after exposure to DxP or TF-targeted DxP-NPs for 4 h. The values reported are means±SD of three separate experiments. bP<0.05 (vs DxP-treated values for each experimental condition tested).

