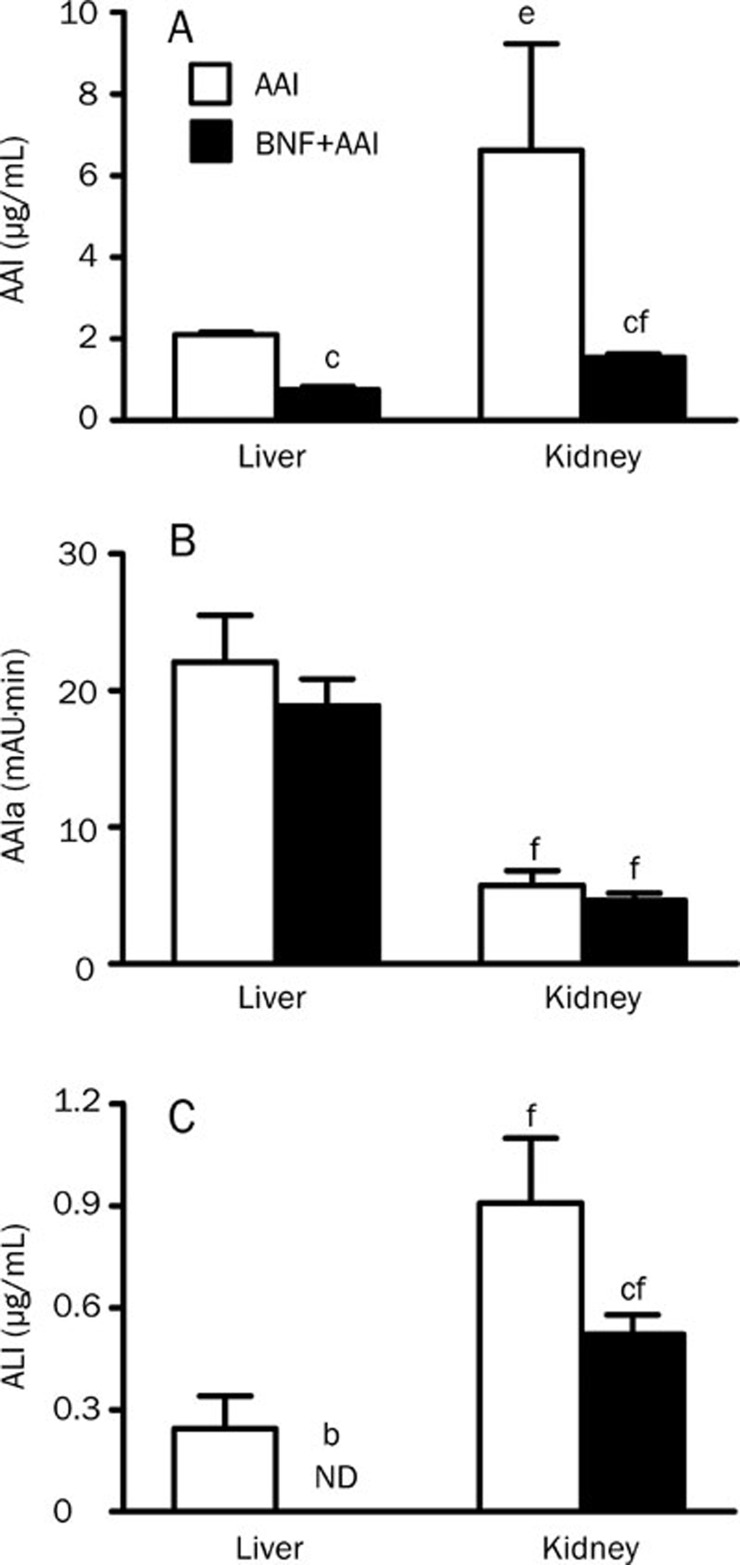
Figure 5.
AAI and its major metabolites AAIa and ALI in liver and kidney. Tissue samples from mice of AAI and BNF+AAI group were collected at 30 minutes after AAI injection to determine the levels of AAI and AAIa. (A) AAI, (B) AAIa, (C) ALI. n=5. Data are expressed as mean±SD. ND, not detectable. bP<0.05, cP<0.01 vs AAI group. eP<0.05, fP<0.01 vs the level of AAI in liver.

