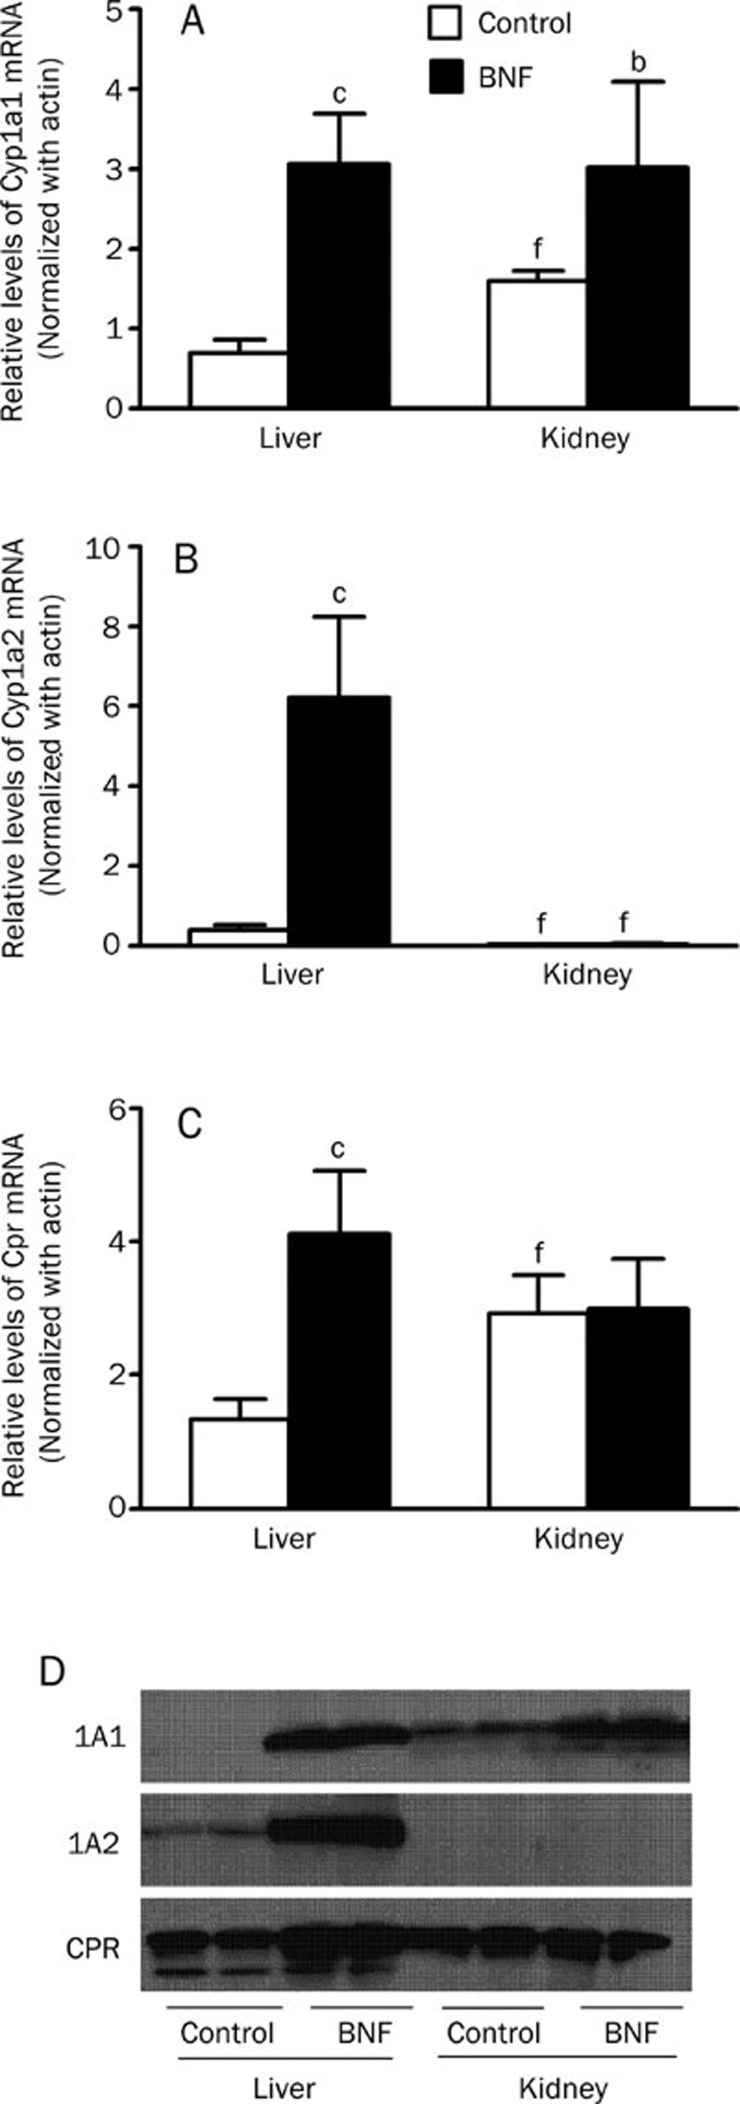
Figure 6.
CYP1A1, CYP1A2, and CPR mRNA and protein levels in liver and kidney. Tissues were collected at 24 h after the last injection from mice of CO and BNF group. Microsomes were prepared and RNA was extracted. (A) CYP1A1, (B) CYP1A2 and (C) CPR mRNA by real-time PCR analysis are shown. n=5. Data are expressed as mean±SD. bP<0.05, cP<0.01 vs control group. fP<0.01 vs the level of mRNA in liver. (D) Western blotting analysis of CYP1A1, CYP1A2, and CPR proteins.

