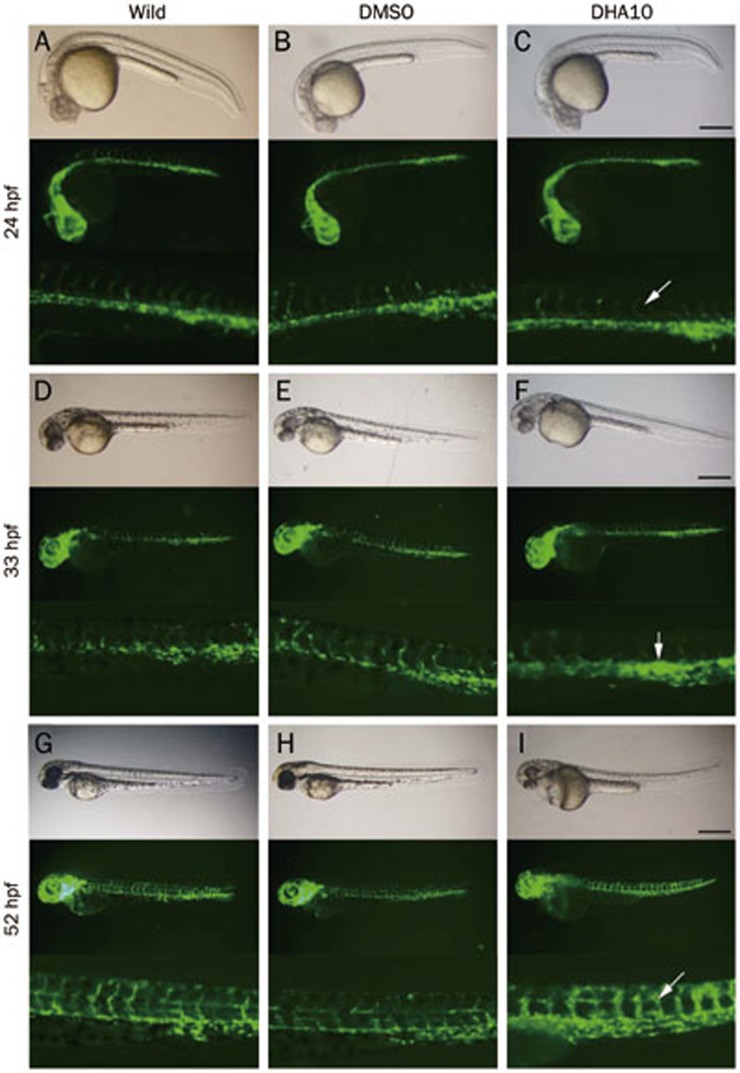
Figure 3.
Embryos from the TG (flk1:GFP) zebrafish line display angiogenesis abnormalities with dihydroartemisinin (DHA) exposure. Three groups of embryos were used to compare changes including the untreated, DMSO-treated and DHA-treated (10 mg/L DHA) groups, and different developmental stages were selected to show changes, including 24 hpf (A, B, C), 33 hpf (D, E, F), and 55 hpf (G, H, I). The white arrows in panels C, F, and I indicate abnormalities in embryos compared with untreated and DMSO-treated embryos. The embryos shown in all panels are lateral views. The scale bar represents 500 μm for the first and second row in each panel and 1500 μm for the third row in each panel.

