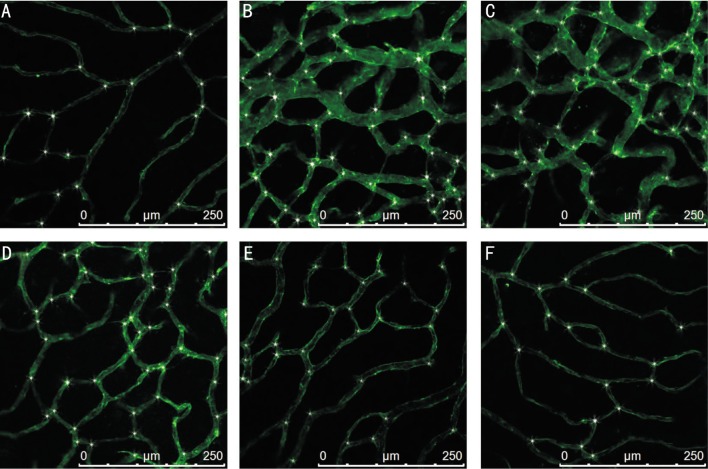
Figure 2. Rat retinal flat mount in high magnification. At P17, rat retinal flat mounts were stained with fluorescein labeled GSL I–isolectin B4 and scanned with laser scanning confocal microscope.
A: Controlled group; B: ROP group; C: Vehicle-treated ROP group; D: Low doses sorafenib-treated ROP group; E: Middle doses sorafenib-treated ROP group; F: High dose sorafenib-treated ROP group. Asterisks: Vascular branching.

