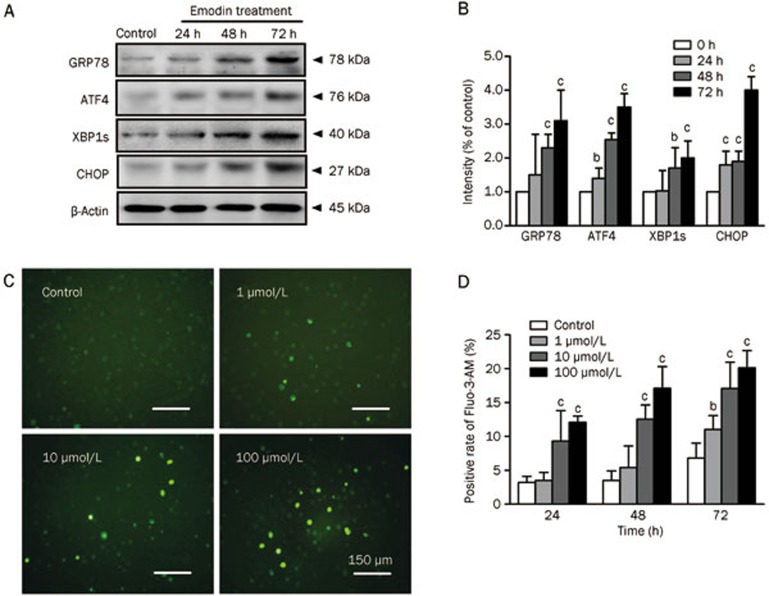
Figure 4.
Endoplasmic reticulum stress and intracellular free calcium elevation of human T cells after emodin treatment. (A) Markers of ER stress including GRP78, ATF4, XBP1s and CHOP were detected by Western blotting. (B) The results of Western blotting were analyzed by Quantity One software. (C) Intracellular calcium measurement shown by Fluo-3-AM staining after emodin treatment for 72 h. (D) Positive rate of Fluo-3-AM staining in different emodin treatment groups. The results are given as mean±SD from three experiments. bP<0.05, cP<0.01 vs control.

